Present Project Phases Clearly with Infographic

Product Description
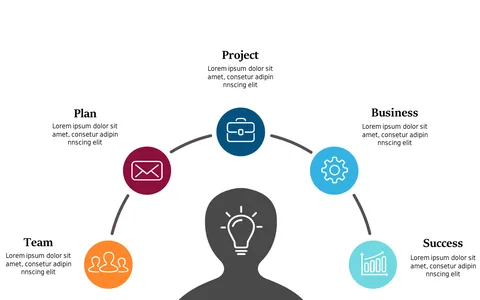
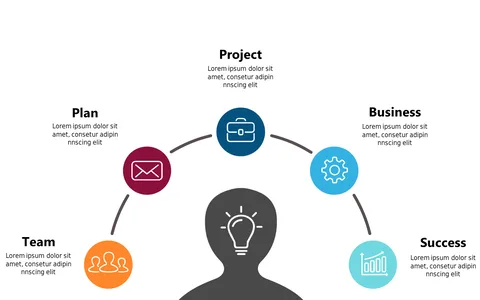
Translating complex project phases into something clear and understandable can be a daunting task for operations managers. This infographic slide simplifies that challenge by providing a structured overview of Initiation, Planning, Execution, Control, and Closure, creating an engaging visual that enhances audience comprehension.
Use this slide during project kickoff meetings, training sessions, or performance reviews to help project coordinators, program directors, and team leaders articulate the essential stages of a project. It’s designed to ensure everyone is aligned and understands the project timeline in a visually appealing way.
At just $0.99, this slide can be instantly downloaded and is easy to edit in PowerPoint and Google Slides.
You can customize it to fit your specific requirements and have it ready for your next meeting in no time.
$0.99 – Purchase Checkout
Added to cart