Visualize Data with Engaging Pie Chart Layout
Product Description
When you’re faced with the task of presenting complex financial data, a cluttered slide can leave your audience confused and disengaged. You need a solution that captures attention while effectively conveying the information.
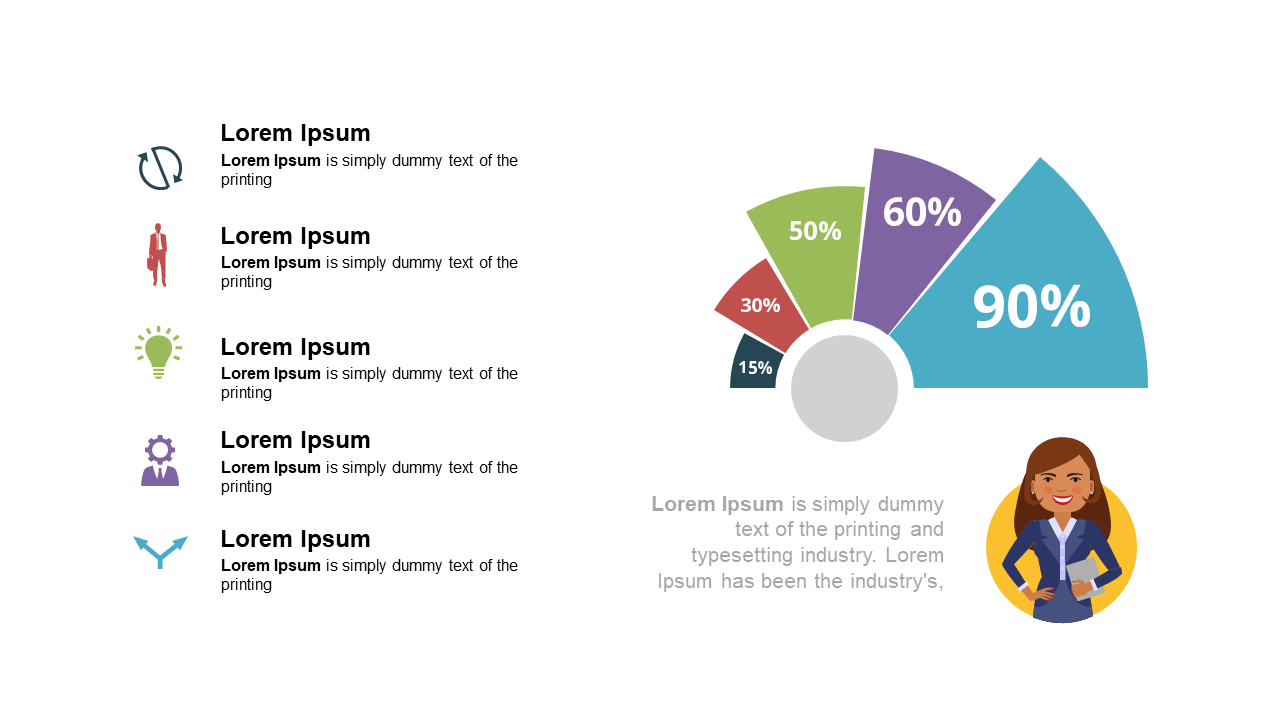
This pie chart slide uses vibrant colors and clear labels, making data easy to digest and visually appealing. Financial analysts preparing for quarterly reviews can use this layout to showcase budget allocations, while sales teams may find it useful for presenting market share distribution in client meetings. It’s also ideal for educators or trainers summarizing survey results during workshops.
For just $0.99, this slide is available for instant download and can be easily edited in PowerPoint or Google Slides. Get your data visualization in prime shape within minutes, allowing you to focus on delivering your message.
$0.99 – Purchase Checkout
Added to cart







