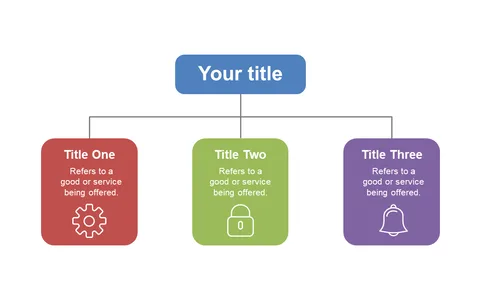
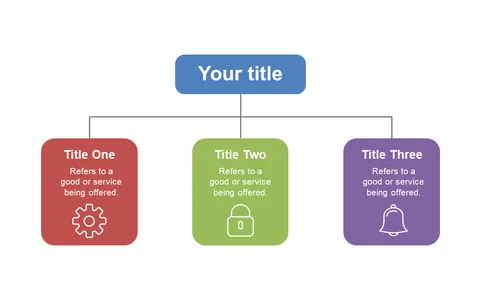
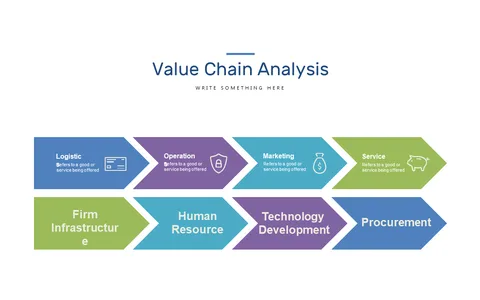
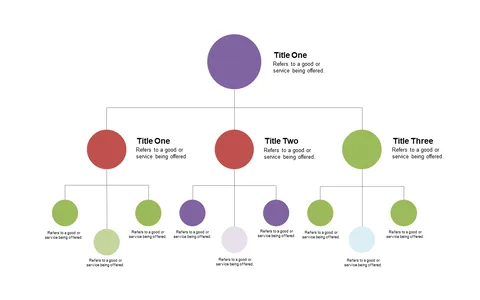
Organizational Chart for Departments and Teams
Product Description
Understanding complex organizational structures can be a headache, especially during team meetings or strategic planning sessions. If your audience can’t visualize how teams and departments relate to one another, it can lead to miscommunication and confusion.
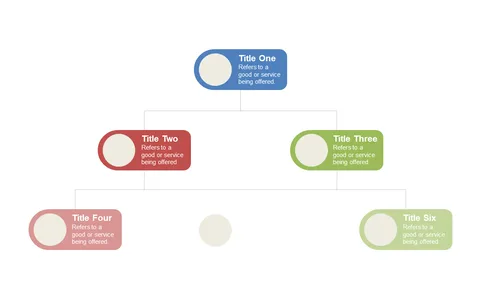
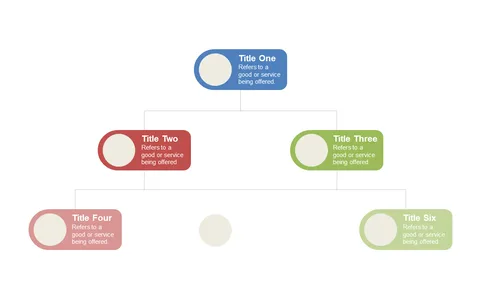
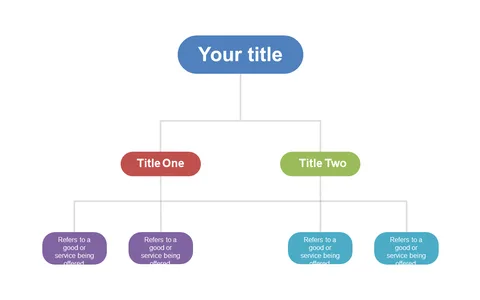
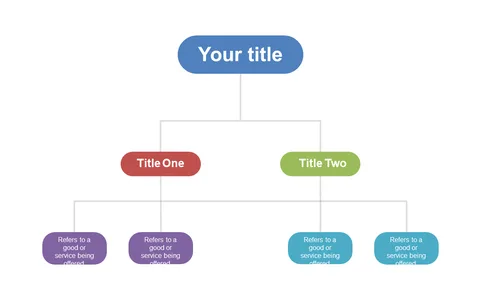
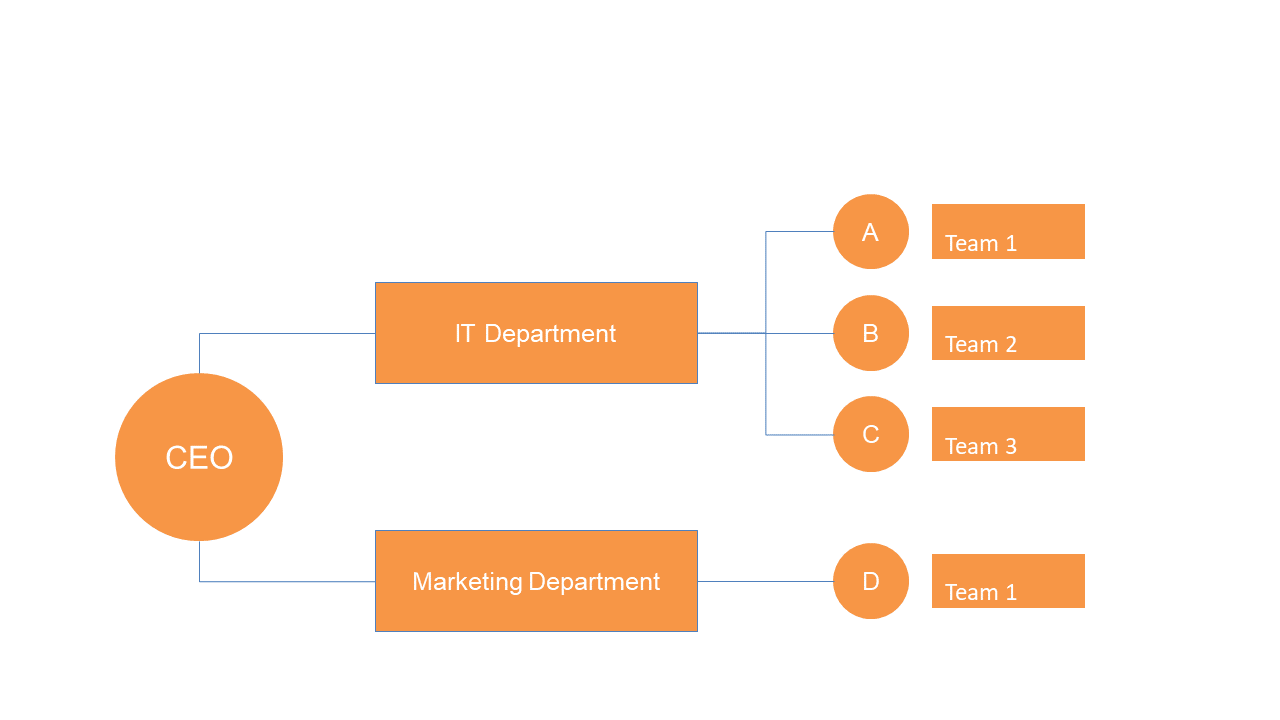
This slide provides a clear organizational chart that lays out hierarchies in a straightforward manner. This slide is particularly useful for managers, executives, and project coordinators who need to clarify roles during department updates or when onboarding new team members. It’s an effective tool for presenting structures in various industries, from corporate settings to educational institutions.
For just $0.99, you can download this slide immediately. It’s easily editable in PowerPoint and Google Slides, allowing you to tailor it to fit your organizational needs with minimal effort.
$0.99 – Purchase Checkout
Added to cart