Differentiate Departments with Circular Org Chart
Product Description
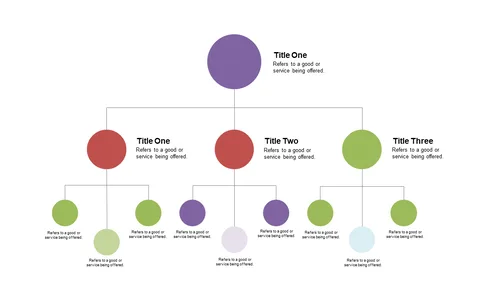
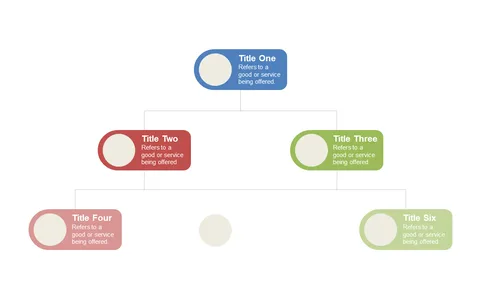
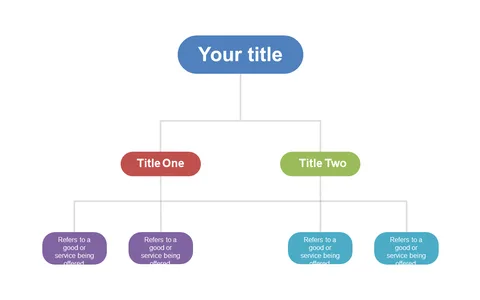
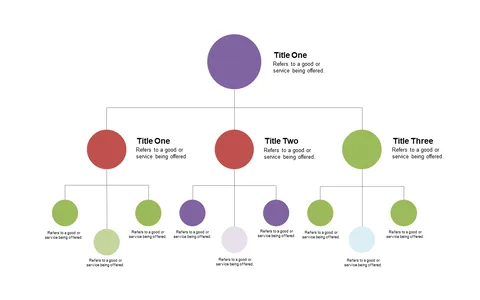
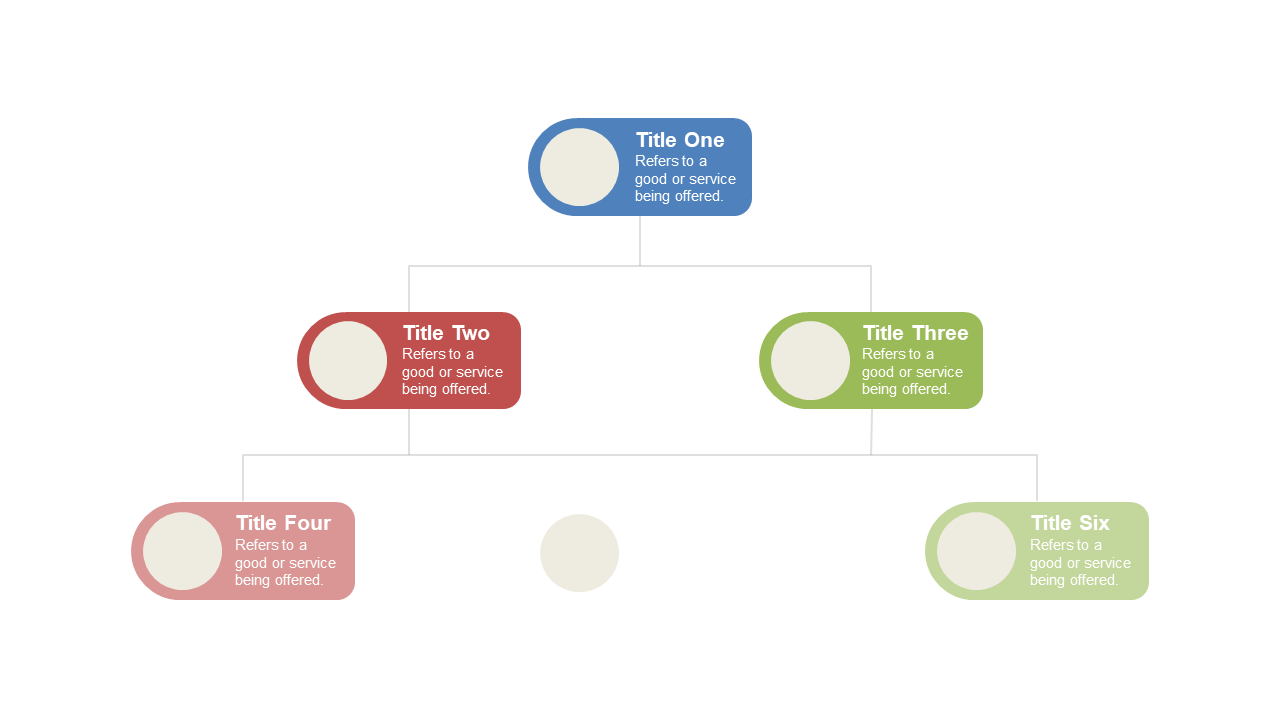
Presenting your organization’s structure can often feel overwhelming, especially when trying to convey complex roles and relationships. The Circular Org Chart simplifies this process, using color-coded circles to represent different departments.
This visual clarity makes it easier for your audience to understand and remember key information. Ideal for operations managers during team updates, or IT directors explaining departmental interdependencies at tech conferences, this slide fits a variety of scenarios. It’s also great for team leaders wanting to clarify responsibilities during project planning sessions, ensuring everyone is on the same page.
Download this slide for just $0.99 and start presenting with confidence in minutes. It’s compatible with both PowerPoint and Google Slides, and easily editable so you can make it your own.
$0.99 – Purchase Checkout
Added to cart