Communicate Team Dynamics with Circle Org Chart
Product Description
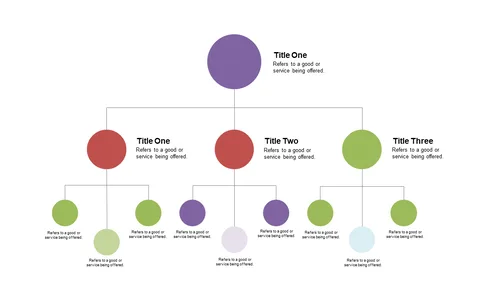
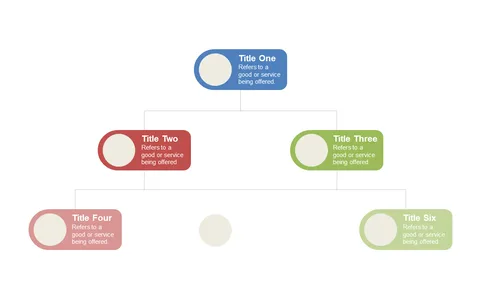
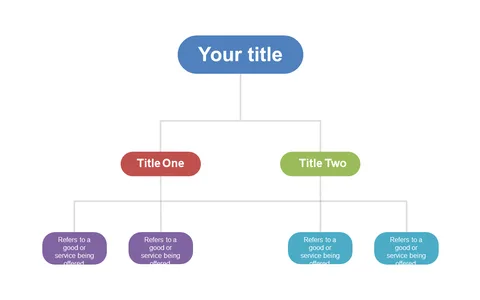
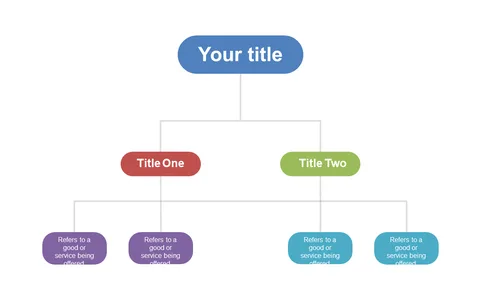
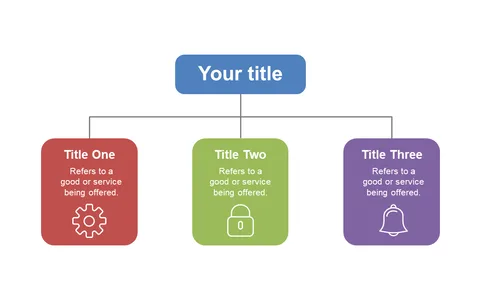
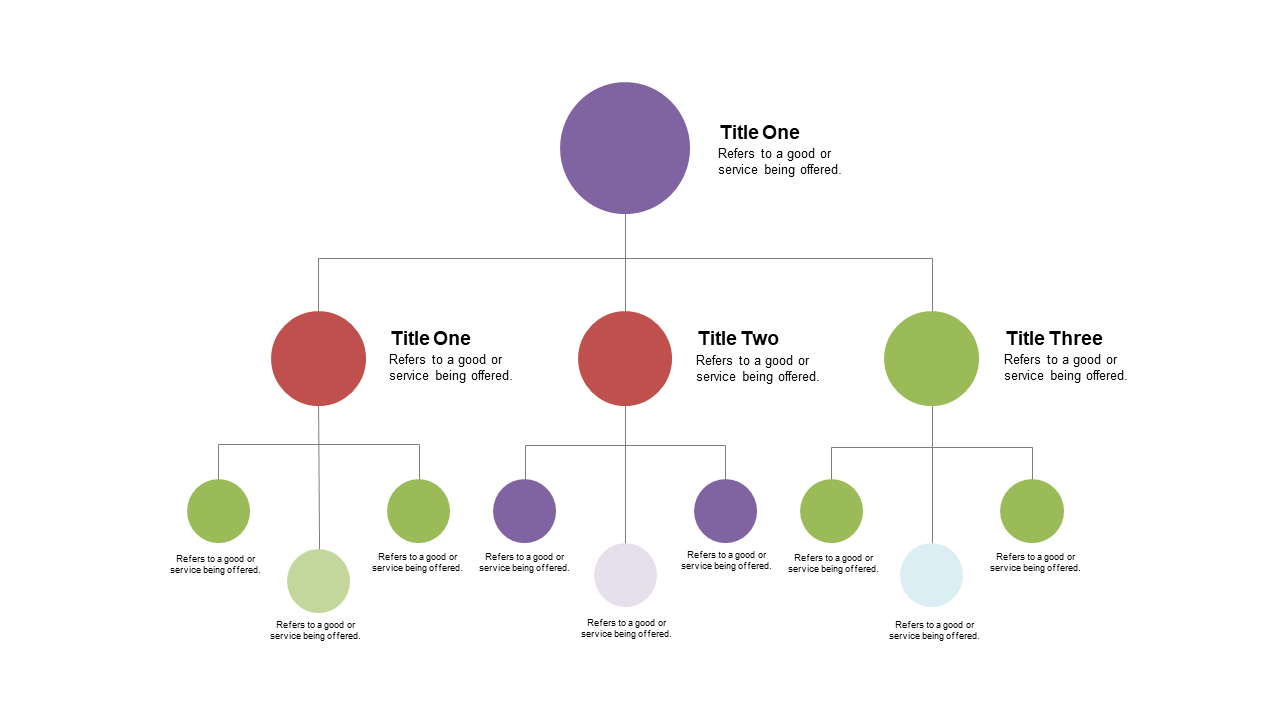
Confusion around team dynamics can disrupt workflow and lower morale. The Circle Org Chart slide cuts through the noise by providing a clear visual representation of relationships within your organization.
This modern layout makes it easier for everyone to understand their role and how they fit into the bigger picture. Project managers in tech startups can benefit from using this slide during team kick-off meetings, while HR professionals can rely on it for onboarding sessions to illustrate the team structure. It’s an effective tool for department heads to clarify responsibilities in cross-functional teams, ensuring everyone knows who to turn to for support.
For just $0.99, you can download this slide and have it ready in minutes. It’s fully editable in PowerPoint and Google Slides, so you can quickly customize it to suit your specific team needs.
$0.99 – Purchase Checkout
Added to cart