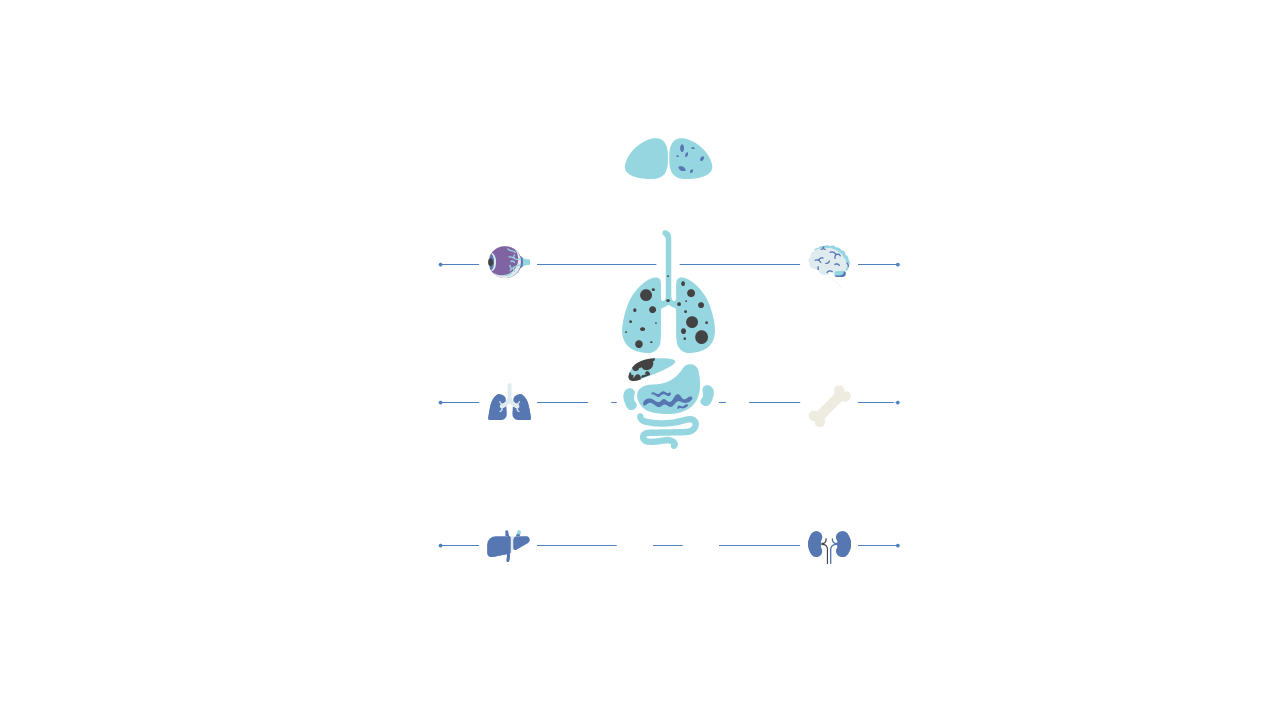
Organ Systems Cycle Diagram for Educational Use
Product Description
Communicating the complexities of the human body can often lead to confusion. This cycle diagram simplifies the intricate relationships of organ systems, making it an essential tool for educators and healthcare professionals.
With clear visuals and straightforward labels, your audience will grasp these concepts more easily. Perfect for biology teachers, medical trainers, or anyone in the educational field, this slide is ideal for lectures, instructional videos, or academic conferences. Use it to visually outline how organ systems interact, making learning more accessible to students or participants.
You can grab this impactful slide for just $0.99, with an instant download that’s ready to edit in PowerPoint and Google Slides. Make quick adjustments to fit your teaching style and bring clarity to your presentations in minutes.
$0.99 – Purchase Checkout
Added to cart







