Visualize North America Regions for Analysis

Product Description
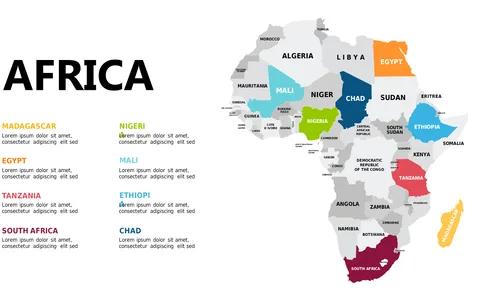
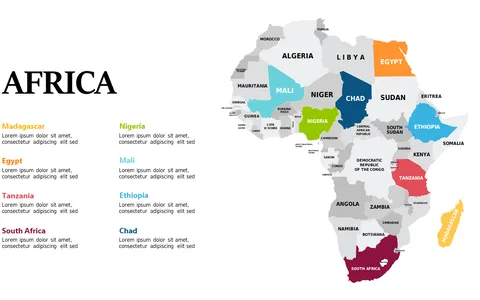
Communicating regional nuances in North America can be a daunting task. This detailed map layout simplifies your job by visually breaking down the key countries, helping your audience grasp the geographical distinctions without getting lost in data.
It’s a must-have for presenting regional analysis. Ideal for geographic analysts, business strategists crafting market entry plans, or educators focusing on North American studies, this slide provides clarity in various scenarios. Use it in strategy meetings, educational sessions, or market research presentations for effective communication.
For only $0.99, you can download this slide instantly. It’s easy to edit in PowerPoint and Google Slides, allowing you to tailor colors and annotations to fit your specific context quickly.
$0.99 – Purchase Checkout
Added to cart