Present Sequential Data with a Multi-Stage Funnel
Product Description
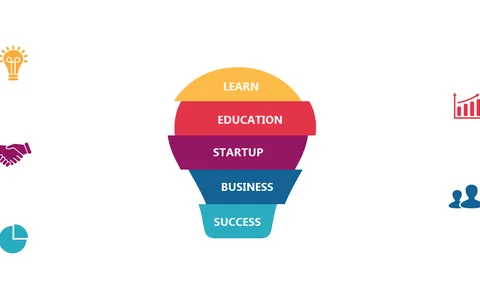
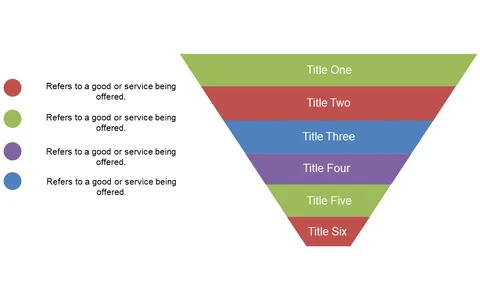
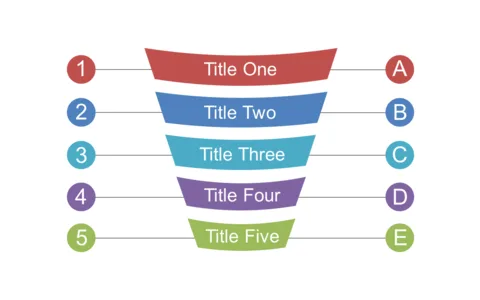
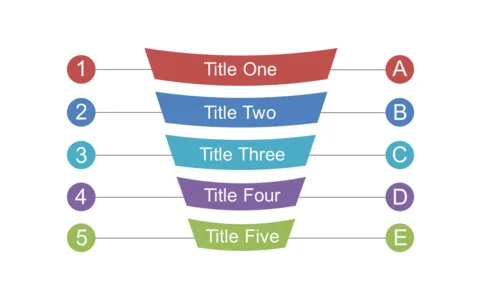
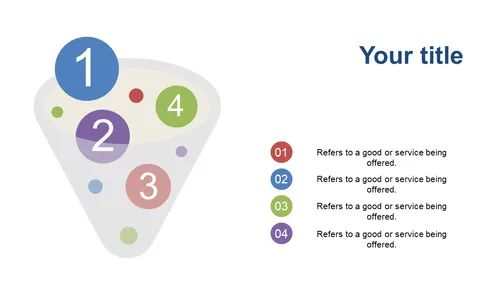
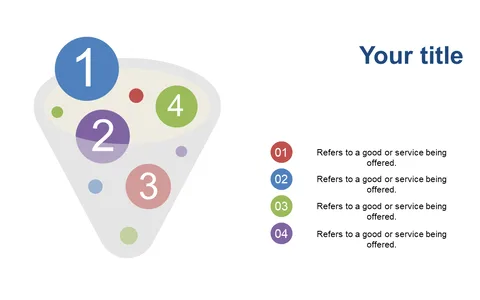
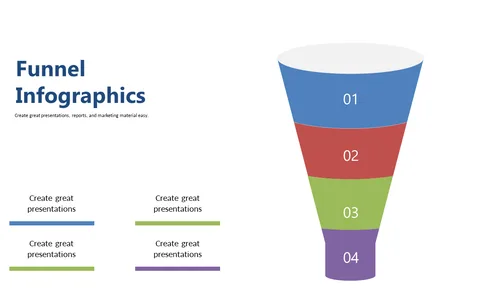
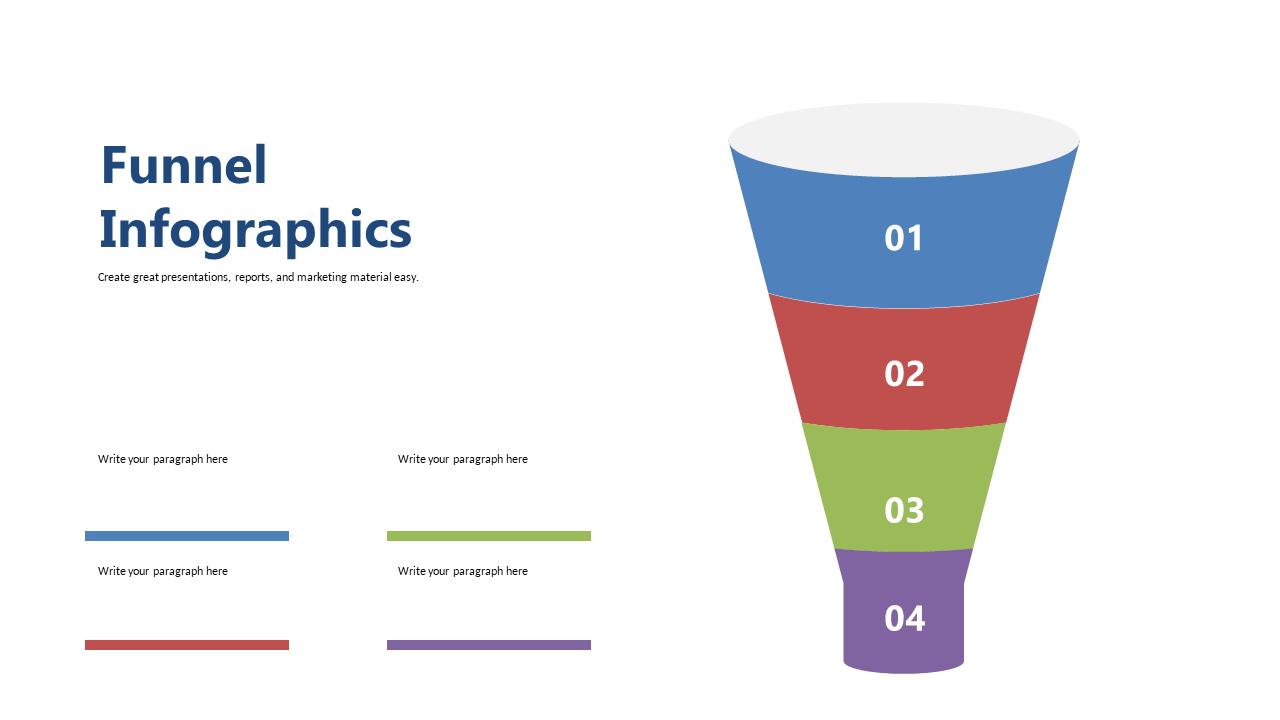
Communicating sequential data in a clear and accessible way can be a challenge, especially when dealing with complex processes. You need your audience to grasp the entire flow of information without getting lost, and this multi-stage funnel infographic achieves that clarity.
Each section is designed to stand out, making complex information easier to understand. This slide is an excellent fit for data analysts, project managers, and operations teams who need to present workflows during status updates or review sessions.
Whether you’re highlighting project milestones or demonstrating a process in a training session, this visual representation will keep your audience on track. For just $0.99, this slide can be downloaded right away and is fully editable in PowerPoint and Google Slides, allowing you to customize it promptly to suit your specific needs.
$0.99 – Purchase Checkout
Added to cart