Showcase Sales Process with Colorful Funnel Diagram V2
Product Description
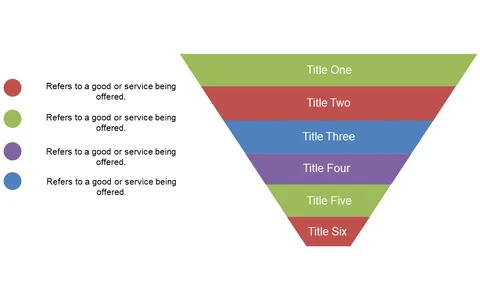
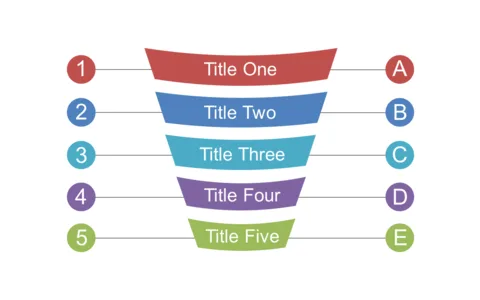
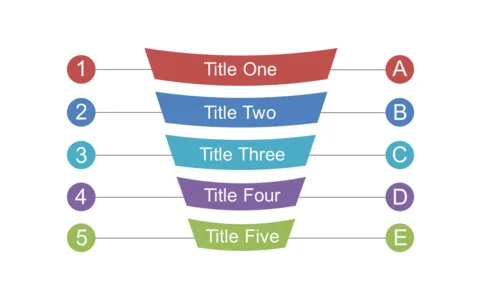
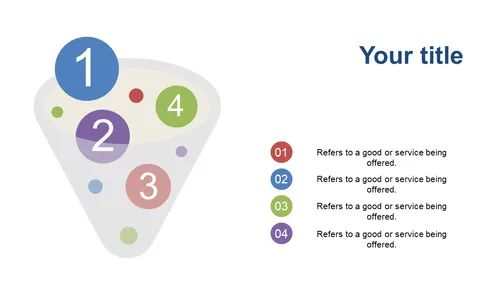
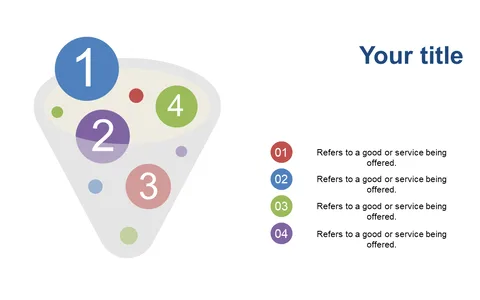
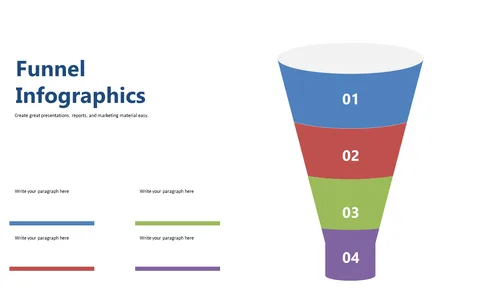
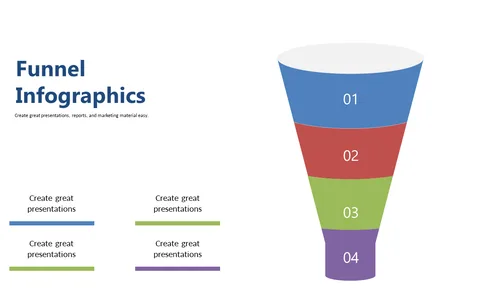
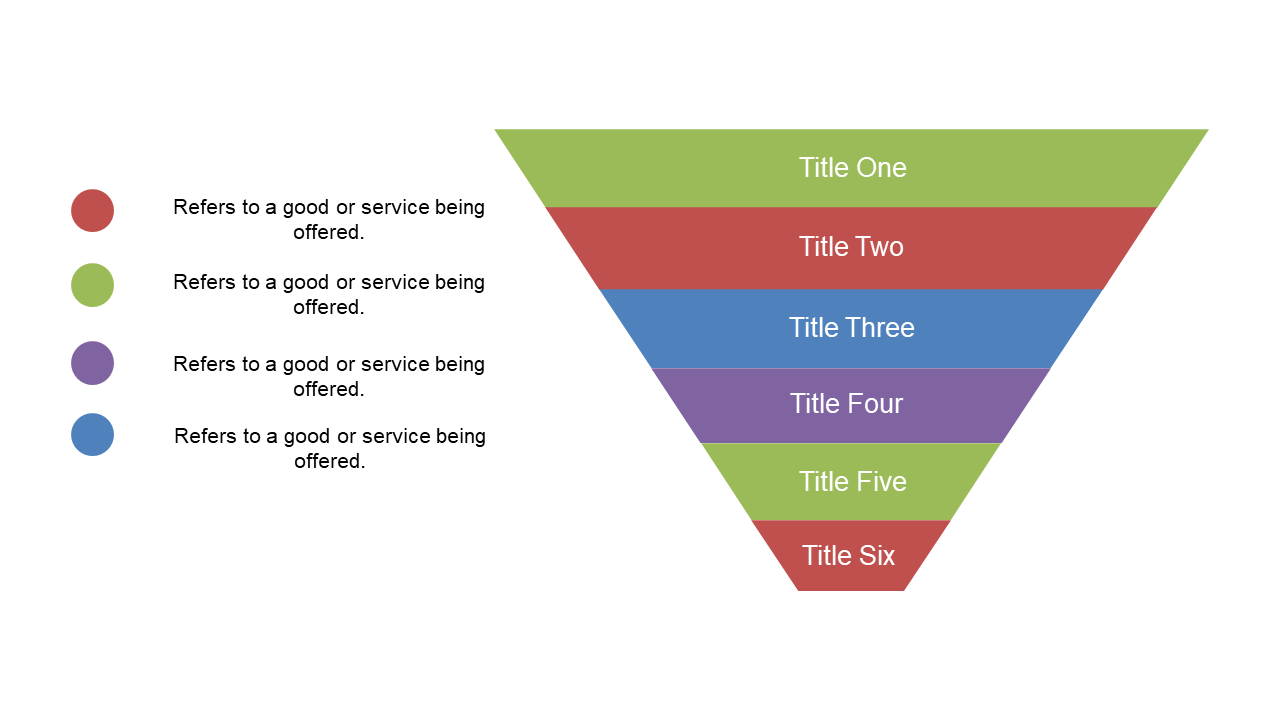
Illustrating the sales process can be a major hurdle for any marketing manager aiming to keep their audience engaged. It’s crucial to present each stage clearly so that everyone understands their role in driving conversions.
This colorful funnel diagram not only captures attention but also organizes your information in a way that’s easy to follow. You’ll find this slide incredibly useful for marketing managers presenting their sales strategies in team meetings or quarterly reviews, as well as those involved in campaign planning sessions. Whether you’re discussing lead generation or conversion tactics, this funnel diagram will help clarify your points and guide the conversation effectively.
At just $0.99, this slide is ready for an instant download and can be easily edited in both PowerPoint and Google Slides. Get started on your presentation in minutes, and make your sales process as vivid as your ideas.
$0.99 – Purchase Checkout
Added to cart