Showcase Sales Processes with a Multi-Stage Funnel
Product Description
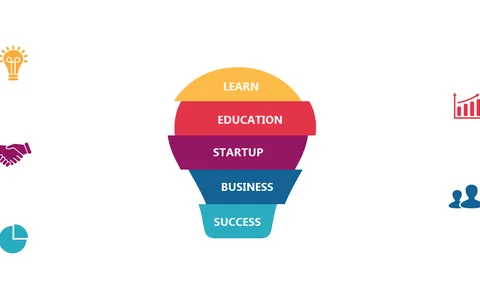
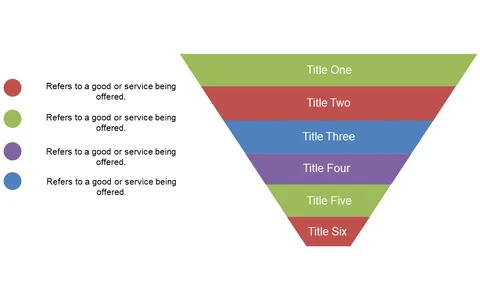
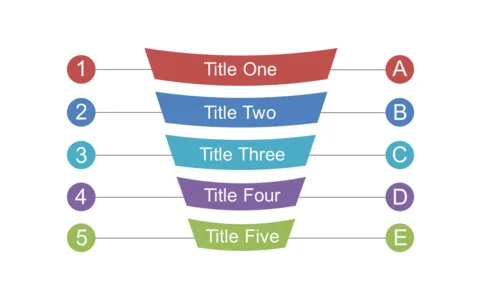
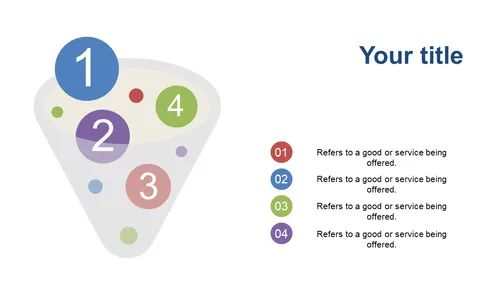
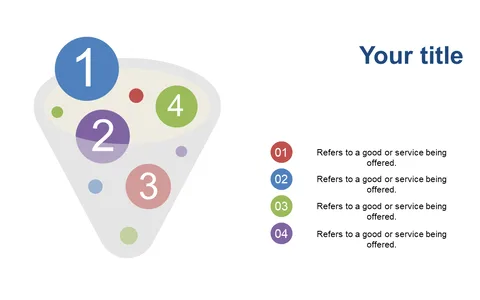
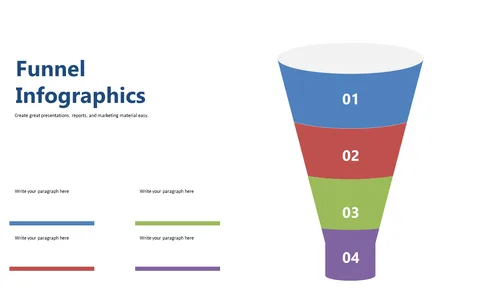
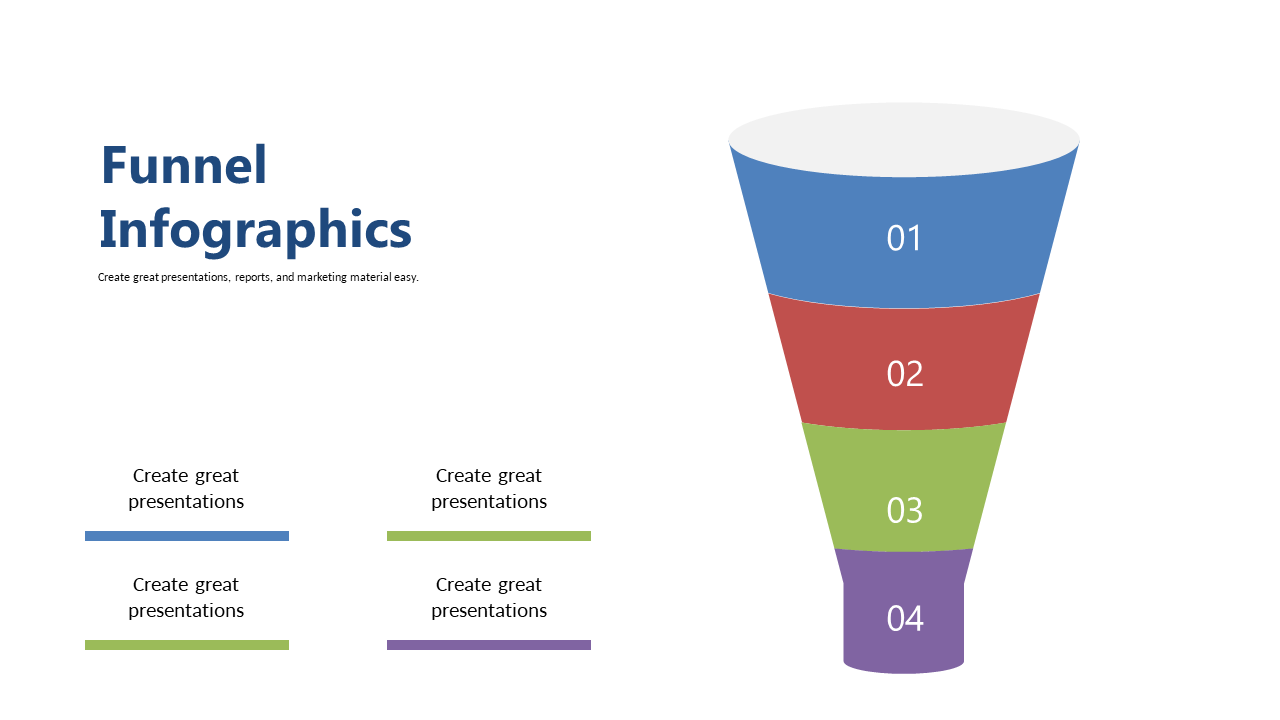
When you need to present intricate sales processes, ensuring clarity is crucial. It’s easy for audiences to become confused when dealing with multiple stages of a sales pipeline, but this multi-stage funnel infographic simplifies that complexity.
You can visually break down each step, making it easier for everyone to follow along. Sales leads, account managers, and business development specialists will find this slide invaluable during sales strategy sessions or when pitching to potential clients.
Whether you’re outlining sales tactics in a meeting or educating new team members during training, this slide helps convey your message clearly. At a low price of $0.99, you can download this slide instantly and customize it in PowerPoint or Google Slides, making it simple to adapt it for your presentation needs in just a matter of minutes.
$0.99 – Purchase Checkout
Added to cart