Engage Your Audience with a Multi-Stage Funnel Infographic
Product Description
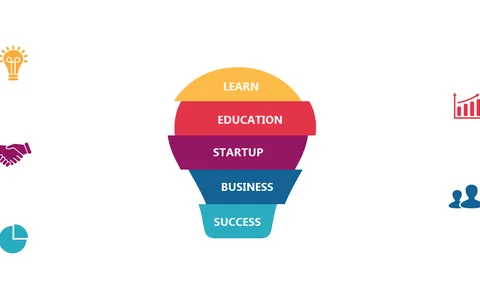
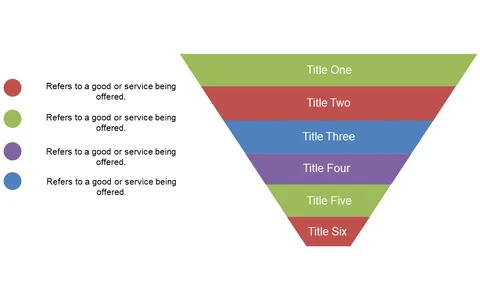
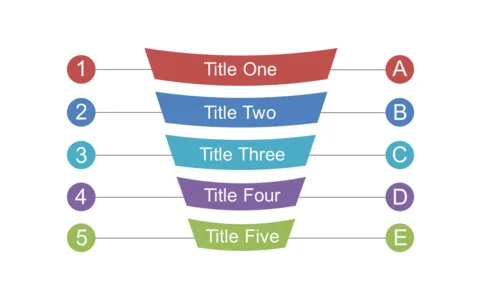
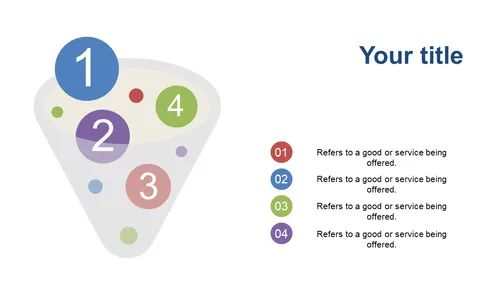
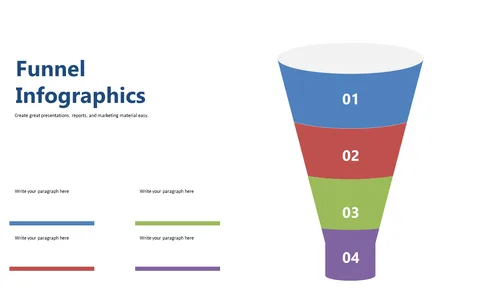
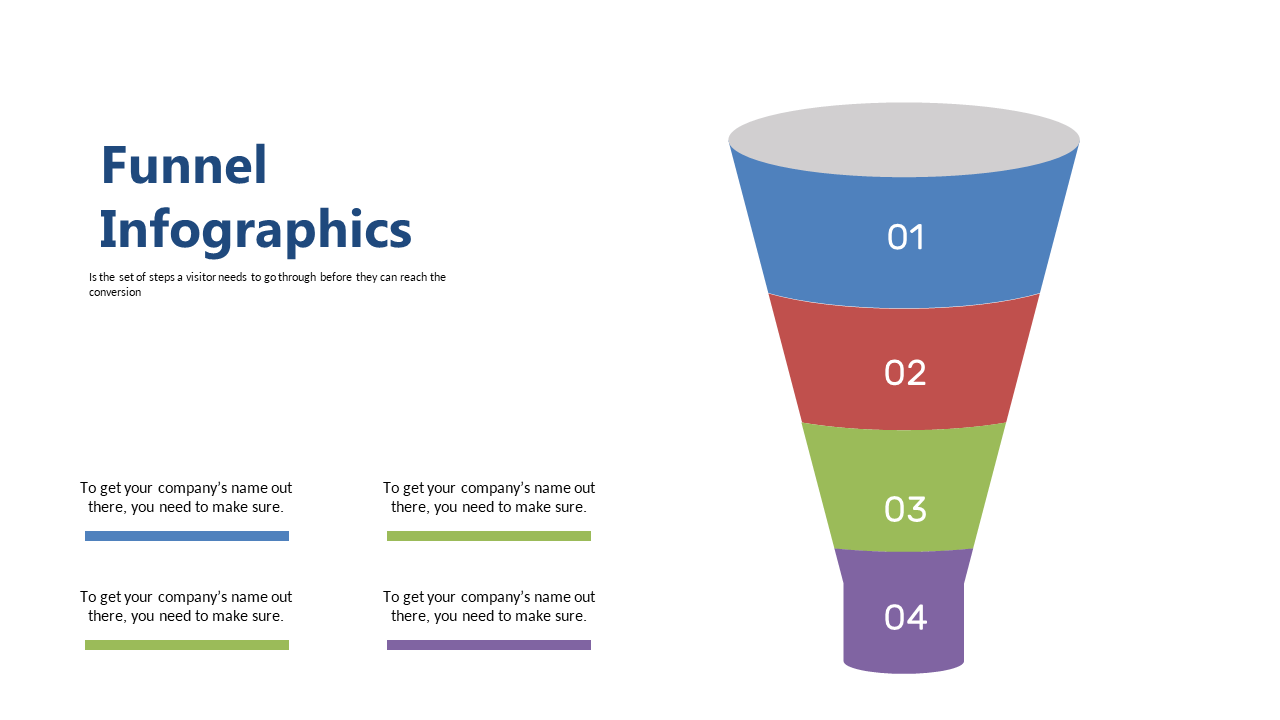
Presenting complex sales data can often lead to confusion and disengagement, diminishing the impact of your message. With a multi-stage funnel infographic, you can transform dense information into a visually appealing format that keeps your audience focused and engaged.
This slide is perfect for sales managers articulating their pipeline during quarterly business reviews, or marketing professionals showcasing conversion processes to their teams. Whether you’re discussing strategies in a boardroom or presenting at a conference, this infographic will enhance clarity and connection.
Available for just $0.99, you’ll receive an instant download that’s easy to edit in PowerPoint or Google Slides. Make your presentations easier to understand and more visually compelling in just minutes.
$0.99 – Purchase Checkout
Added to cart