Analyze Multi-Product Trends with Line Chart
Product Description
Understanding trends over time across multiple products can be tricky without the right visual representation. You need a solution that makes it easy to spot changes and patterns.
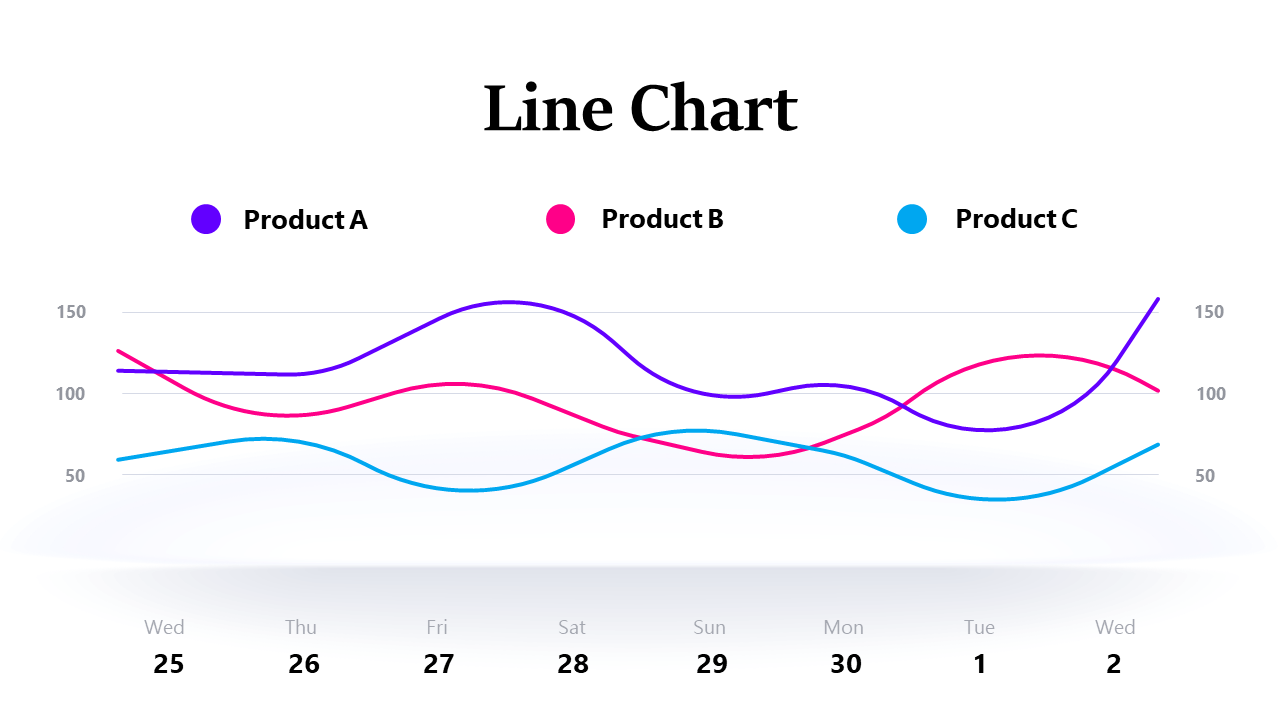
This line chart slide gives you a clear view of performance trends, allowing for quick comparisons that can inform your sales and marketing strategies. Sales teams, marketing analysts, and product managers will find this layout exceptionally useful for presentations that analyze product performance or campaign effectiveness over time. Whether in a quarterly review or a strategy meeting, this chart helps communicate insights that can influence future decisions.
For just $0.99, you can download this customizable line chart, which works effortlessly in both PowerPoint and Google Slides. Editing is a breeze, so you can focus on the analysis while presenting your data stylishly and effectively.
$0.99 – Purchase Checkout
Added to cart







