Compare Product Performance with Line Chart
Product Description
Making sense of product performance across different categories can sometimes feel overwhelming. You want a visual that not only displays the data but also helps you draw actionable insights.
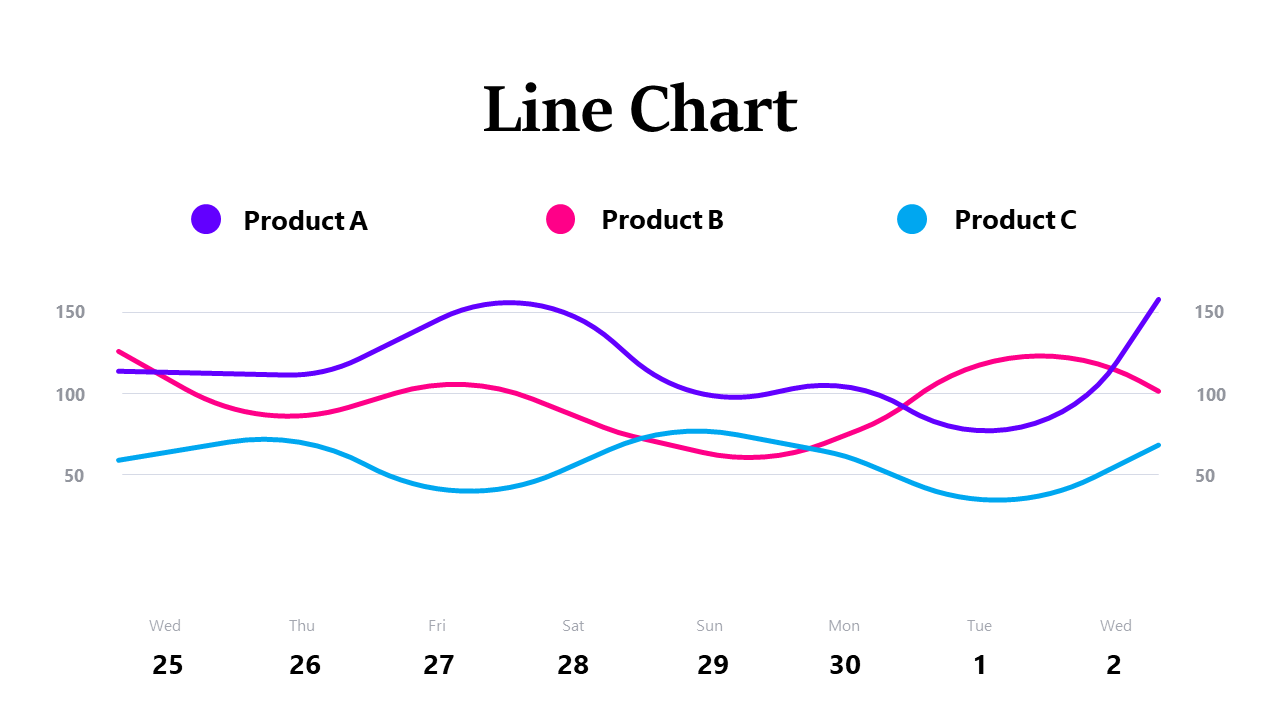
This line chart slide simplifies that process by showcasing trends clearly, making it easy to compare performance metrics over time. Designed for professionals in sales, marketing, and product management, this chart is ideal for meetings where you need to present findings on product performance or market trends. You’ll be able to communicate key insights effectively, ensuring your audience understands the data without getting bogged down in details.
For just $0.99, this line chart is available for instant download and is fully editable in PowerPoint and Google Slides. With an easy-to-edit design, you’ll spend less time on formatting and more time focusing on delivering your insights.
$0.99 – Purchase Checkout
Added to cart







