Multi-Line Trend Analysis Chart for Data Comparison
Product Description
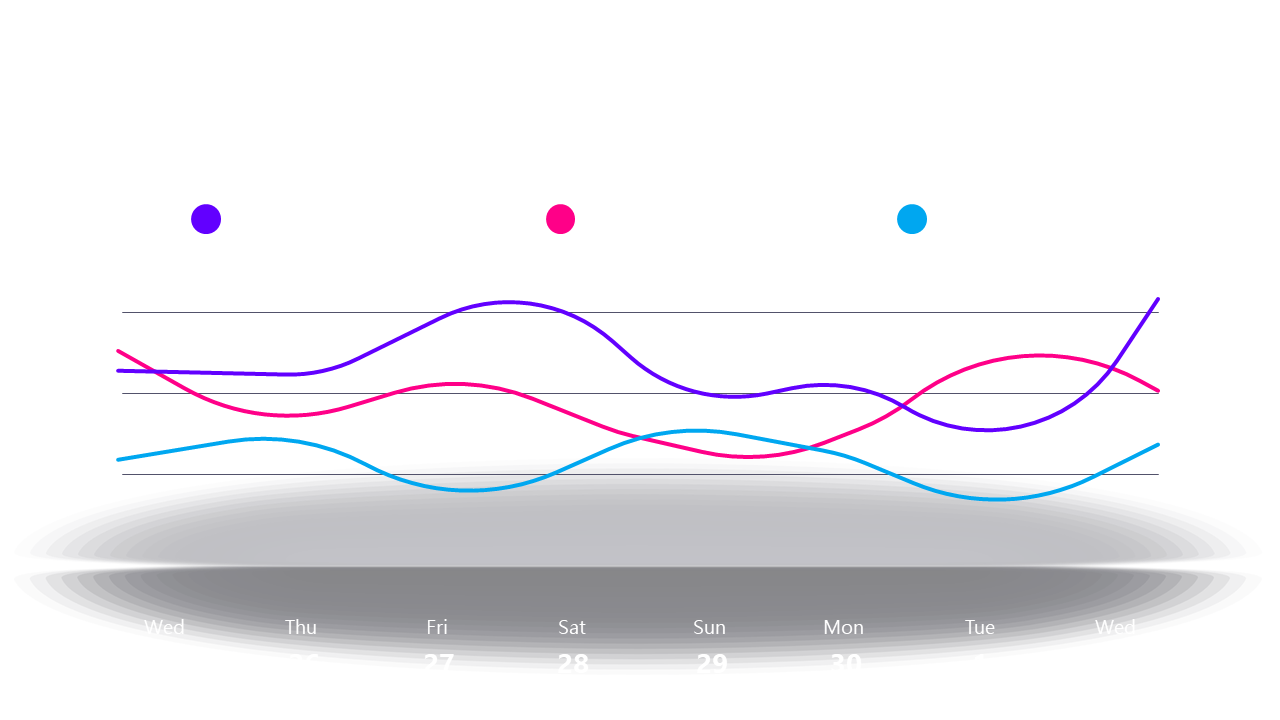
When you need to compare multiple trends over time, it can be challenging to present the data in a way that’s easy to digest. This multi-line trend analysis chart simplifies complex information, allowing your audience to see relationships between variables clearly.
Data analysts, marketing professionals, and project managers can use this layout during quarterly reviews, strategy meetings, or to assess campaign performance. By showcasing different data sets side-by-side, you can facilitate informed discussions and decision-making.
Available for just $0.99, this slide is an instant download that can be tailored quickly in PowerPoint or Google Slides. Grab it now, and you’ll be ready for your next meeting in a matter of minutes!
$0.99 – Purchase Checkout
Added to cart







