Monthly Performance Bar Chart for Business Analysis
Product Description
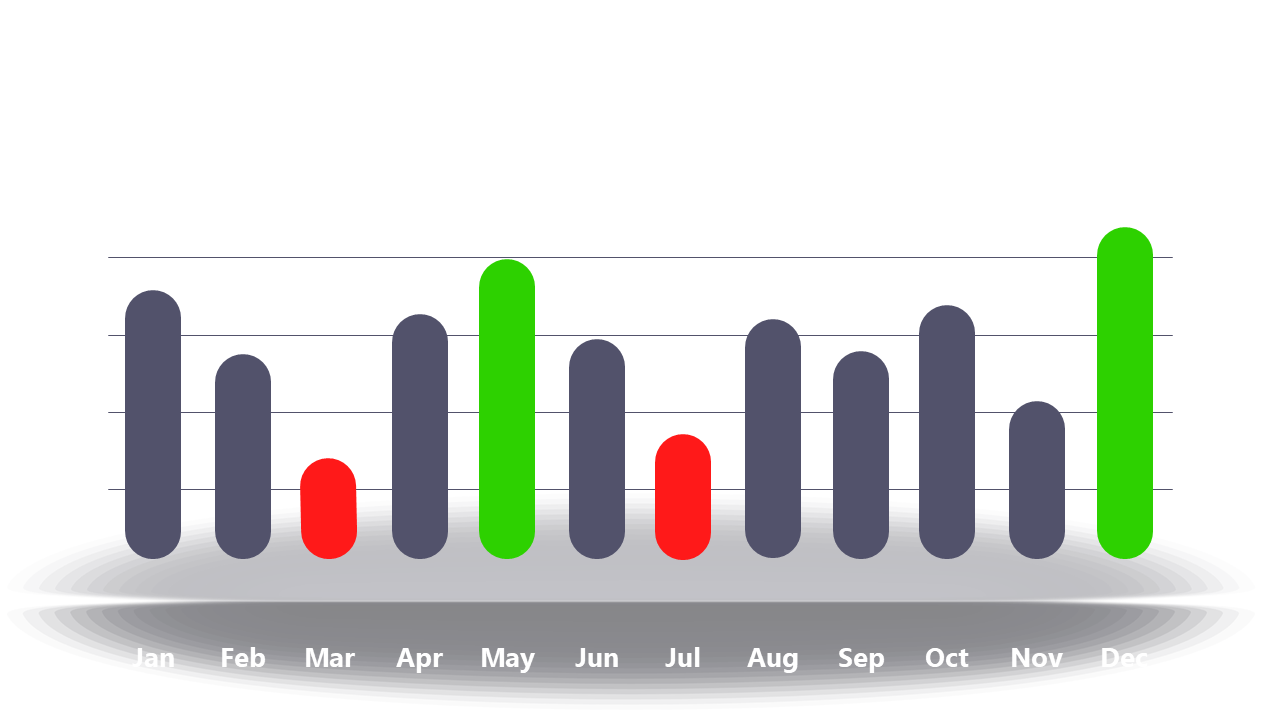
Turning complex data into clear visuals is a common hurdle for business analysts, especially when you want to convey trends effectively. This monthly performance bar chart simplifies your data and highlights key metrics, making it easier for your audience to see the big picture at a glance.
Great for business analysts, finance professionals, and management teams, this slide is ideal for performance reviews or budget meetings where you need to present monthly data trends clearly. Use it to discuss successes and areas for improvement in a way that keeps your audience engaged and informed.
For only $0.99, you can download this slide instantly and customize it to fit your requirements. It works seamlessly in both PowerPoint and Google Slides, allowing you to adjust colors and highlights in just a few clicks for a polished presentation.
$0.99 – Purchase Checkout
Added to cart







