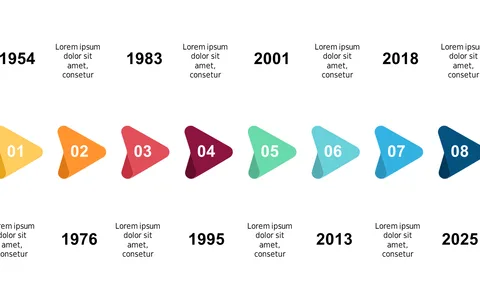
Visualize Milestones with Editable Timeline Layout

Product Description
Tracking project milestones can sometimes feel overwhelming, especially when you need to clearly communicate progress to your team or clients. With this editable timeline layout, you can easily show key events over specific years without clutter.
It simplifies complex information, making it digestible for everyone involved. This slide works well for project managers in construction, software development teams during sprint planning, or marketing teams reviewing campaign timelines. Use it during weekly check-ins, project kick-offs, or when updating stakeholders on progress.
For just $0.99, this slide can be yours with an instant download, and it’s fully editable in PowerPoint and Google Slides. Set it up in minutes to bring clarity to your project milestones.
$0.99 – Purchase Checkout
Added to cart