Present Trends Clearly with a Linear Trend Graph
Product Description
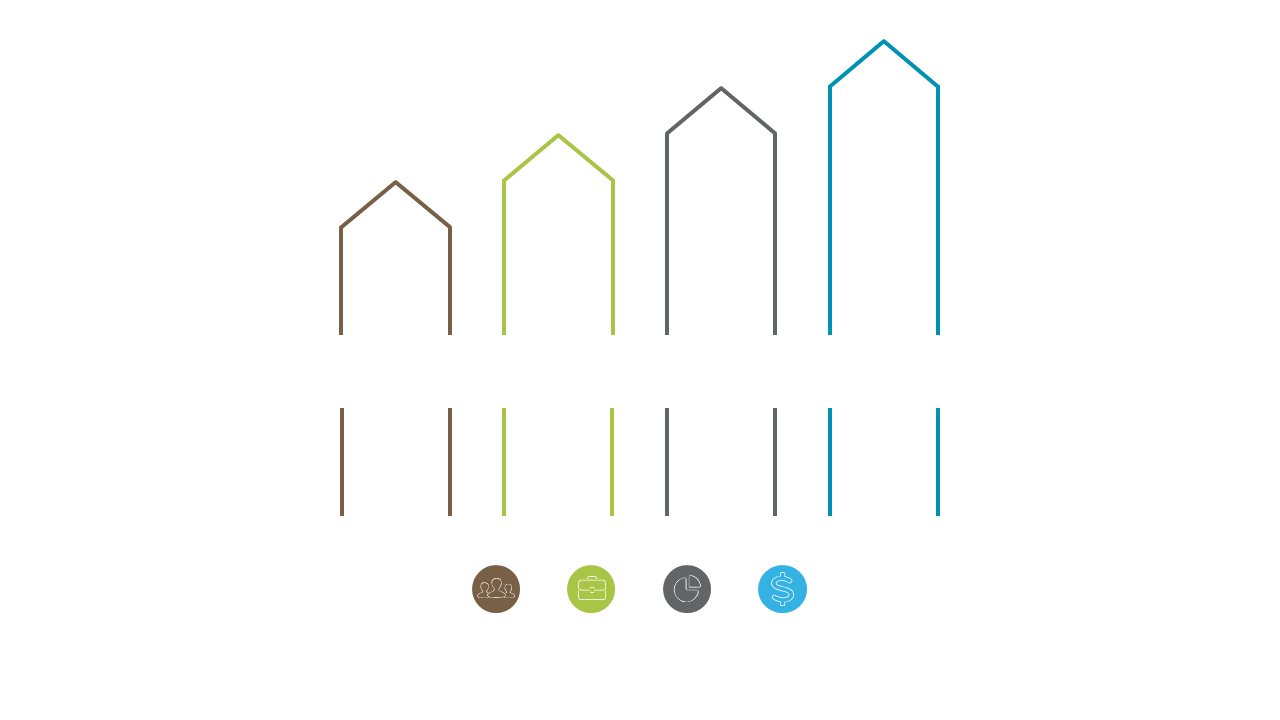
Presenting trends in a way that grabs attention while maintaining clarity can be a struggle for many business professionals. This slide features a polished linear trend graph that allows you to represent your data points and trends effectively, ensuring your audience stays engaged and informed.
Marketing analysts and project managers can use this slide when reporting on performance metrics or growth data during team meetings or client presentations. Its clean design helps in making complex information understandable at a glance, which is crucial for driving home your points.
For just $0.99, this slide is available for instant download, giving you the flexibility to edit it in PowerPoint or Google Slides. It’s designed for quick customization, so you can easily adapt it to fit your presentation needs.
$0.99 – Purchase Checkout
Added to cart







