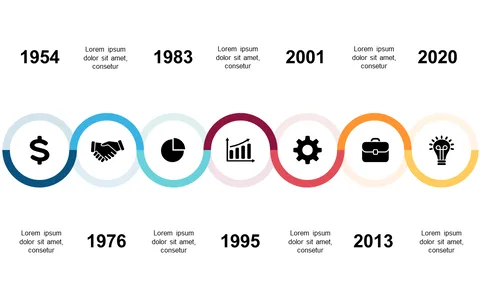
Visualize Events with Linear Timeline Layout

Product Description
Telling a story with timelines can be tricky, especially when trying to keep your audience engaged. As an operations manager, you need a clear visual that narrates your milestones, whether for project tracking or showing historical events. This linear timeline layout helps you present your information in a colorful, easy-to-follow format that tells a compelling story.
This slide is perfect for professionals in project management, education, or historical research. It can be used by team leaders summarizing project phases during updates or educators showcasing milestones in a history lesson. It’s designed to make your presentations not just informative but also engaging.
For just $0.99, this slide is available for instant download. It’s easy to edit in PowerPoint and Google Slides, so
you can customize it to reflect your unique narrative quickly and efficiently.
$0.99 – Purchase Checkout
Added to cart