Compare Usability and Design Metrics Visually
Product Description
You know how difficult it can be to convey complex product metrics in a way that truly resonates. When comparing usability and design scores, it’s crucial to present that information clearly and visually, so your audience can quickly grasp where your product stands against the competition.
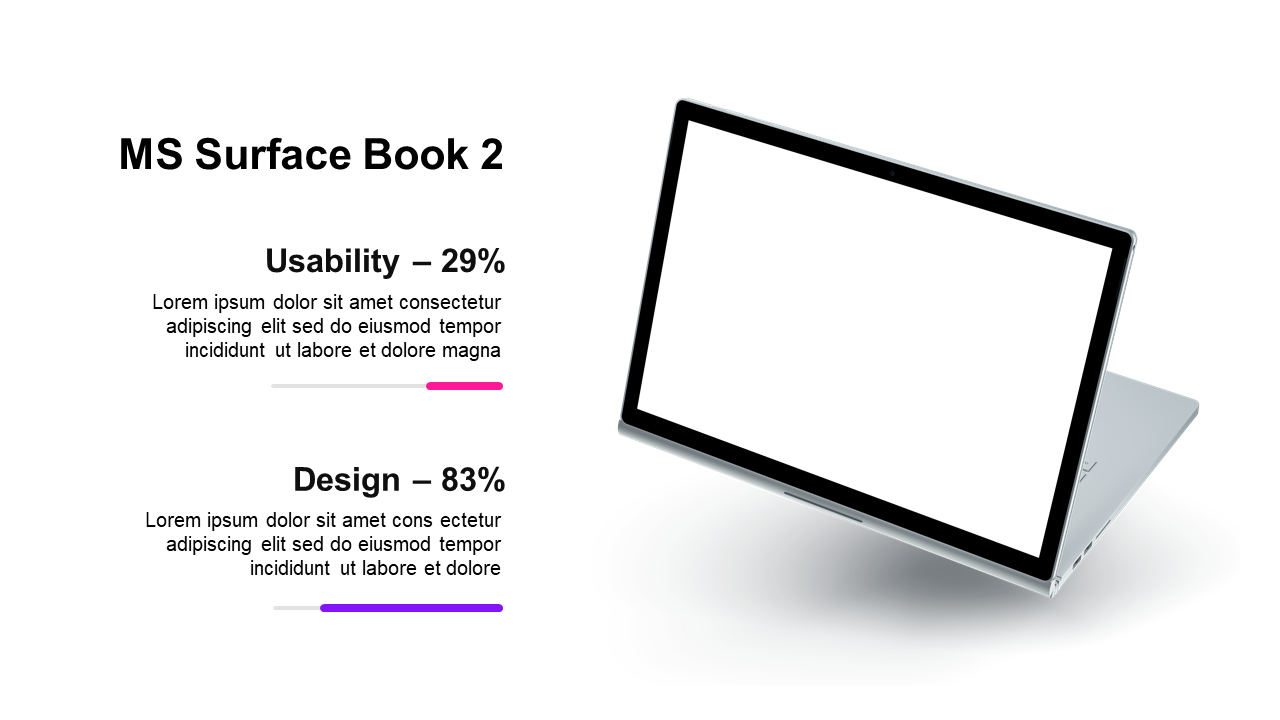
This slide helps you achieve that by offering a streamlined visual comparison of these key performance metrics. Whether you’re a product manager at a tech startup analyzing user feedback or a marketing director in a larger firm preparing for a competitive review, this slide is designed for you. Use it in quarterly performance meetings or product design discussions to deliver impactful insights that spark conversation and drive decisions.
You can download this slide for just $0.99, and it’s ready for immediate use. With fully editable text and metric percentages, customizing it in PowerPoint or Google Slides takes just minutes, so you can focus on your presentation, not on the setup.
$0.99 – Purchase Checkout
Added to cart







