Showcase Real Estate Progress Over Time

Product Description
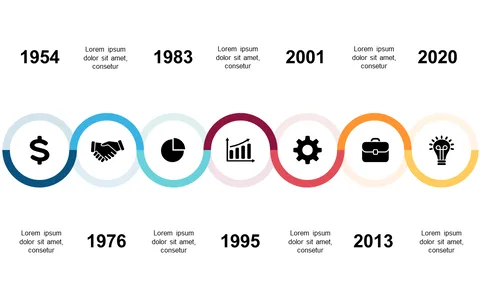
Communicating project timelines can be a real headache, especially in the fast-paced world of real estate development. When you need to showcase the progress of a project over several years, you want to ensure your audience is engaged and understands the critical milestones without getting lost in jargon or overly complex charts. This timeline slide simplifies that task with visually appealing isometric illustrations.
This slide is perfect for program managers and real estate developers who need to present project updates during stakeholder meetings or community presentations. Whether you’re discussing new commercial properties or residential projects, this engaging visual helps keep everyone on the same page.
It’s also ideal for construction managers reporting on timelines to clients or investors. You can easily download this slide for just $0.99, and it’s ready to go in minutes. Edit it in PowerPoint or Google Slides to fit your specific project details and timeline, making your next presentation both informative and visually striking.
$0.99 – Purchase Checkout
Added to cart