Hourly Waterfall Chart for Data Trends
Product Description
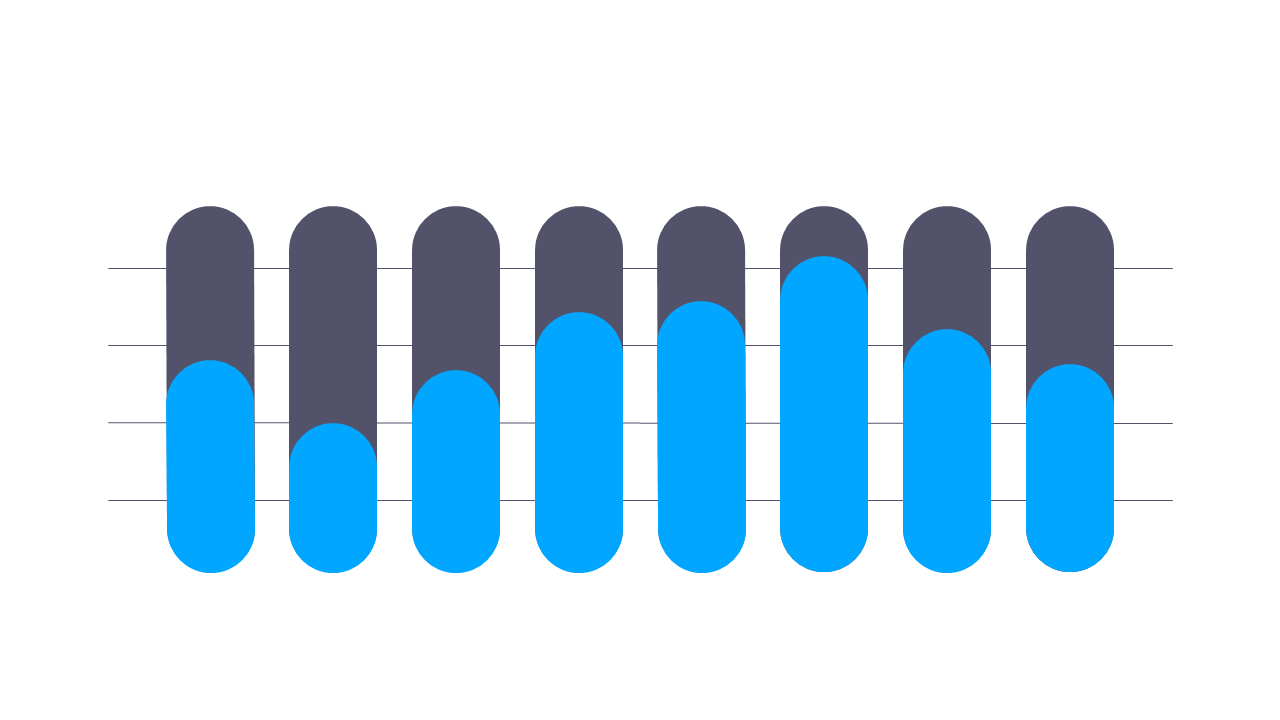
Displaying data trends over a 24-hour period can often be overwhelming without the right visual tool. This Hourly Waterfall Chart gives you the ability to present time-specific data clearly and effectively, helping your audience make sense of the information.
Ideal for business analysts, customer service managers, or anyone needing to present hourly metrics, this slide works well in performance evaluations, incident reports, or operational reviews. Its visual appeal will keep your audience engaged while ensuring the data remains the focus.
At just $0.99, this slide is available for instant download and easy editing in PowerPoint or Google Slides. Get it today, and have it ready for your next presentation within minutes!
$0.99 – Purchase Checkout
Added to cart







