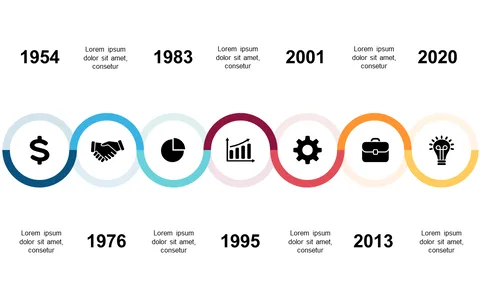
Present Yearly Milestones with Timeline Layout

Product Description
Highlighting project progress can feel daunting, especially when you need to convey numerous key achievements effectively. A well-organized timeline can serve as a powerful communication tool to keep everyone aligned and informed.
This timeline layout is suited for product managers, project coordinators, and team leaders who need to present yearly milestones during development meetings or product reviews.
It’s a straightforward way to illustrate your work’s evolution and what’s on the horizon. Available for $0.99, this slide is easy to download instantly, and you can edit it effortlessly in PowerPoint or Google Slides to match your project narrative.
$0.99 – Purchase Checkout
Added to cart
✅ Instant delivery
✅ Fully editable
✅ PowerPoint & Google Slides
Category:
$0.99
Per slide · No minimum · Pay only for what you pick
✓ $0.99/slide
No minimum order
✓ Mix any category
No subscription
Building a full deck?
Mix slides from any of our 58 categories —
all merged into one PowerPoint.
$0.99/slide, no minimum.
Browse All Slides →