Communicate Historical Data with Horizontal Timeline

Product Description
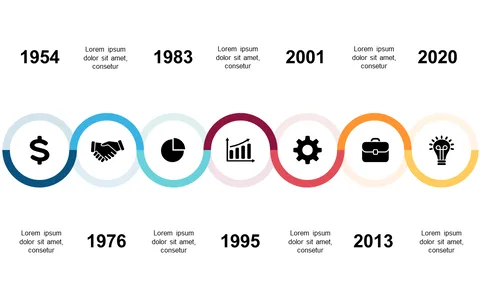
Getting historical data across to your audience can be a challenge, especially when there’s a lot to cover. This horizontal timeline slide simplifies complex information, allowing you to present key milestones over several years in a manner that’s straightforward and engaging.
Operations managers will find this slide invaluable when sharing quarterly reports, business analysts can use it to depict market trends, and educators may benefit from it when presenting historical developments. In any scenario where context and chronology are crucial, this visual aid will help you keep your audience focused.
For only $0.99, you can instantly download this slide and customize it to fit your data perfectly. It’s easy to edit in PowerPoint and Google Slides, so you can make adjustments in just a few clicks.
$0.99 – Purchase Checkout
Added to cart