Compare Values with Horizontal Bar Chart
Product Description
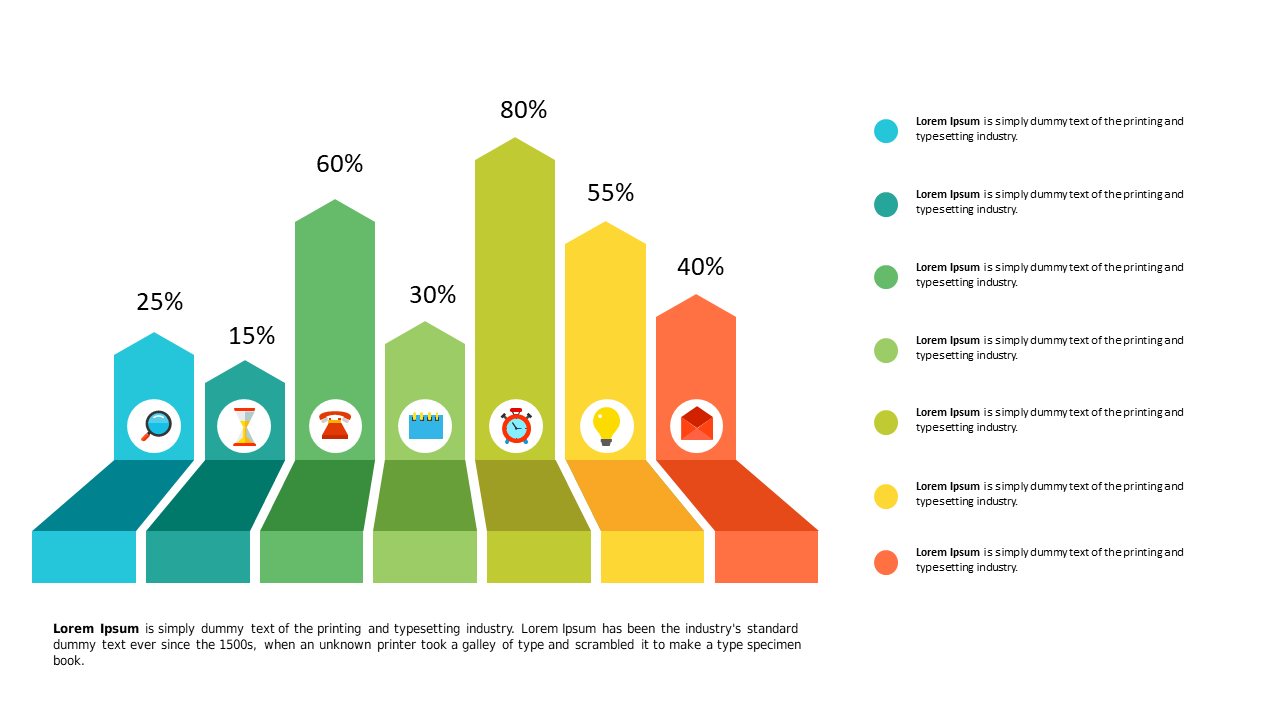
When you’re under pressure to illustrate comparisons, making data clear can feel like an uphill battle. This horizontal bar chart simplifies the comparison process, allowing you to present values in an engaging and visually appealing way that your audience can easily follow.
It’s perfect for sales managers analyzing quarterly performance against targets, financial analysts comparing budget allocations, or product teams evaluating feature usage. Use this slide in your budget meetings, performance reviews, or strategy sessions to clearly communicate important information.
Available for only $0.99, this slide can be downloaded instantly for editing in both PowerPoint and Google Slides. You’ll have everything ready in minutes, giving you more time to prepare for your presentation.
$0.99 – Purchase Checkout
Added to cart







