Compare Metrics with Horizontal Bar Chart Design
Product Description
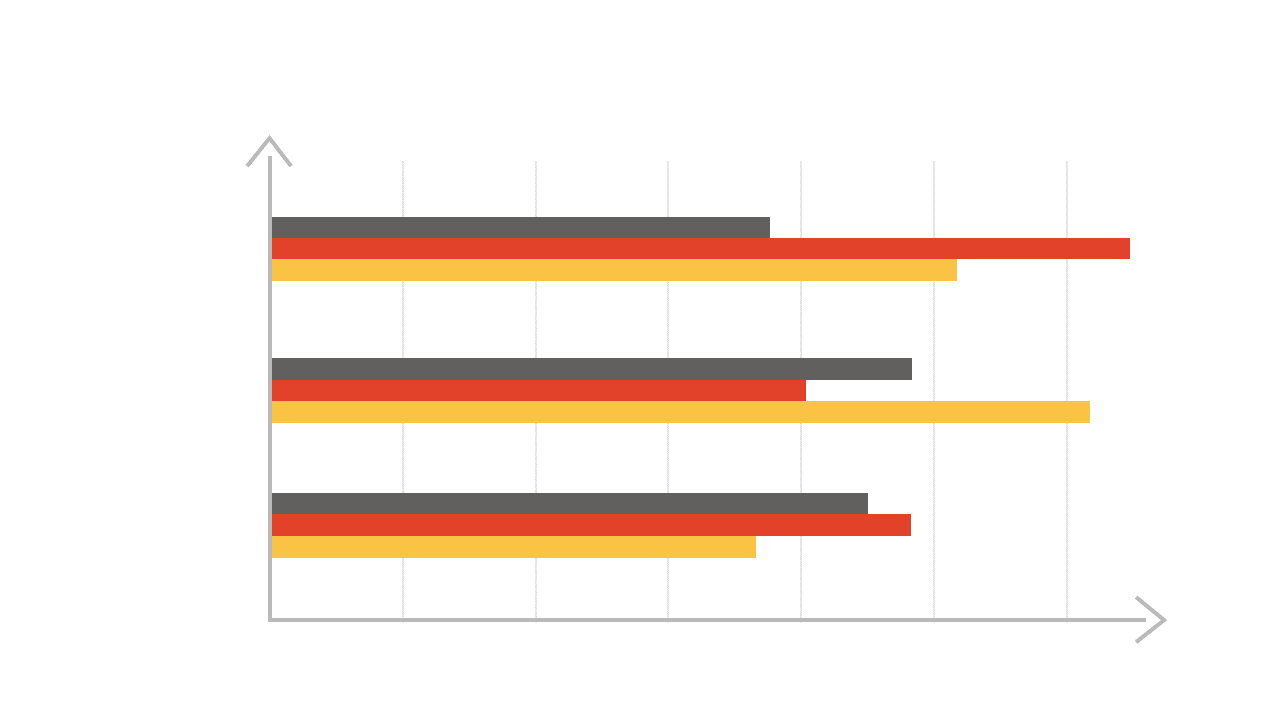
Presenting data for comparison can often lead to confusion, especially when your audience needs to quickly grasp multiple metrics. This horizontal bar chart design cuts through the noise and provides a clear visual representation, allowing your information to stand out and be easily understood.
This slide is perfect for marketing managers looking to compare campaign performance, sales professionals assessing quarterly targets, or project managers evaluating project timelines. Anyone who needs to present detailed metrics in a straightforward manner will find this template invaluable in meetings, reports, and presentations.
For just $0.99, you can download this slide instantly. It’s ready for quick edits in both PowerPoint and Google Slides, allowing you to customize colors and data values in a matter of minutes.
$0.99 – Purchase Checkout
Added to cart







