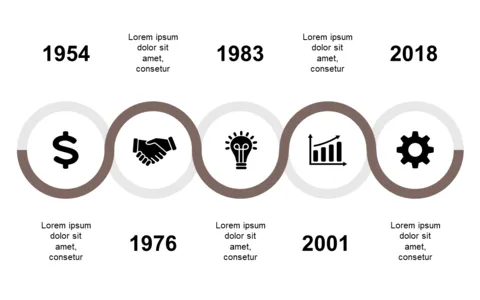
Visualize 5-Day Progress with Timeline Layout

Product Description
Visualizing progress over a defined timeframe can be a challenge, especially when trying to keep your team on the same page. This timeline slide focuses on a five-day layout, making it simple for you to outline key milestones and events.
You’ll be able to highlight important tasks without losing sight of the overall objectives. Ideal for program managers tracking daily progress, team leaders conducting briefings, or educators summarizing weekly goals, this slide can serve various contexts. Whether you’re in a fast-paced meeting or a detailed planning session, visualizing progress helps keep everyone aligned and motivated.
At just $0.99, this slide is available for instant download and is quick to edit in both PowerPoint and Google Slides. Customize it to fit your specific timeline and start presenting in minutes.
$0.99 – Purchase Checkout
Added to cart