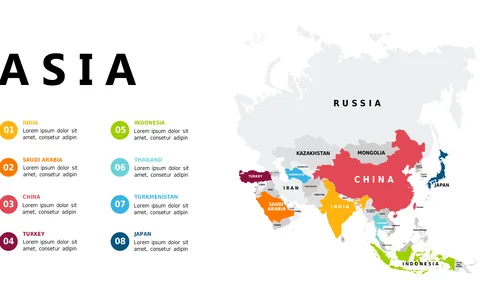
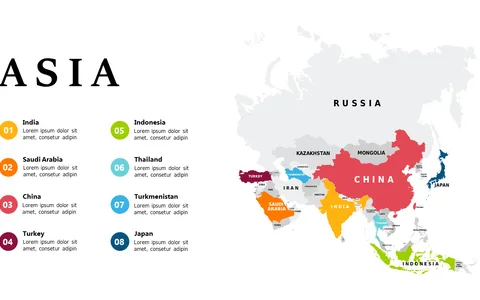
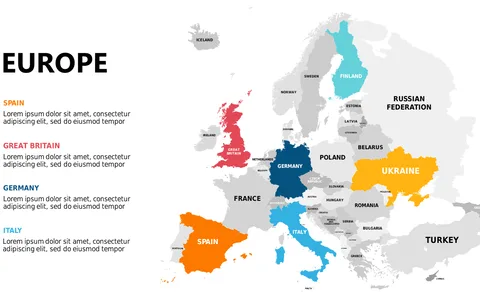
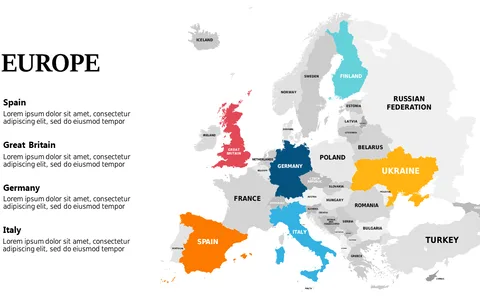
Segmented Map of Saudi Arabia for Presentations

Product Description
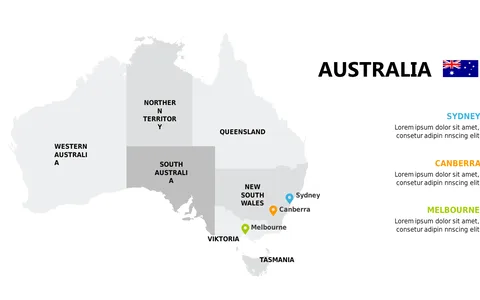
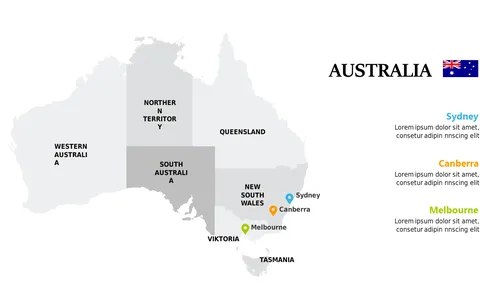
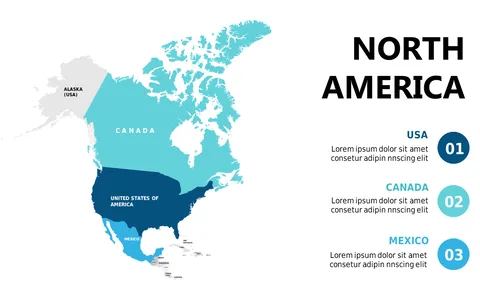
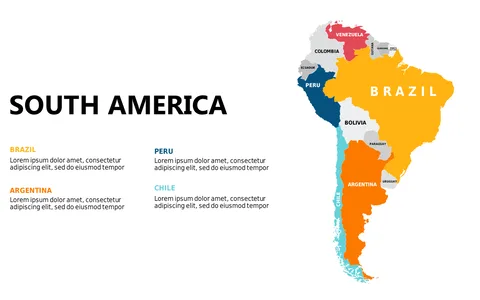
Trying to convey information about Saudi Arabia without a strong visual can leave your audience lost. With this segmented map, you can break down complex regional data into easily digestible visuals that enhance your narrative and keep everyone engaged.
Consider this slide for logistics managers outlining distribution routes, travel planners comparing regional tourism stats, or business development teams presenting market entry strategies. The clear divisions in the map make it incredibly useful for any scenario where geographical data is crucial.
Available for just $0.99, this slide is ready for immediate download and can be quickly edited in PowerPoint or Google Slides. You’ll have a professional visual to work with in no time.
$0.99 – Purchase Checkout
Added to cart