Clarify Team Structures with Color-Coded Org Chart

Product Description
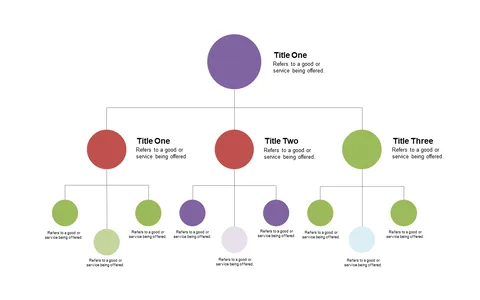
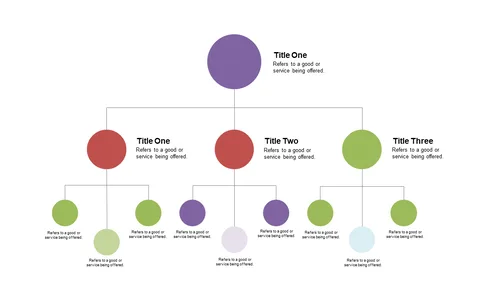
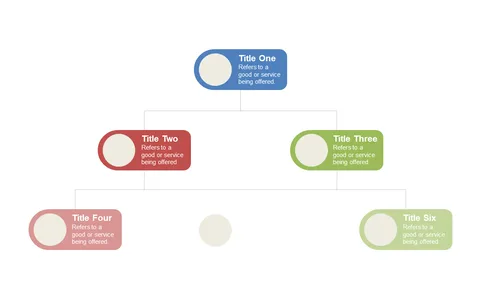
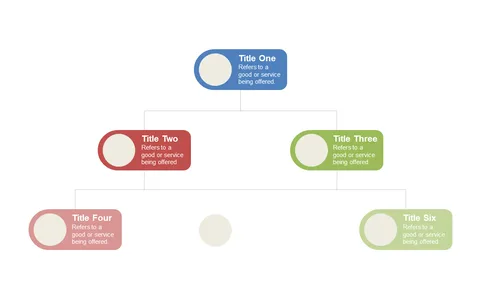
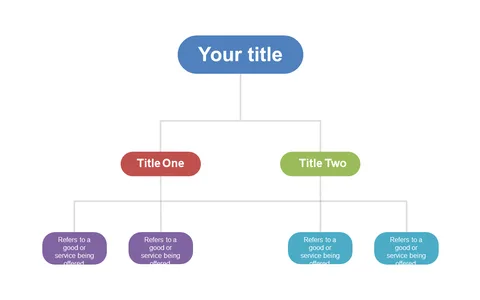
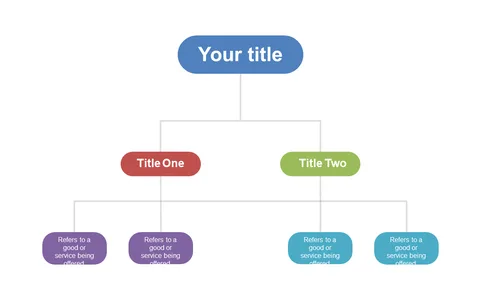
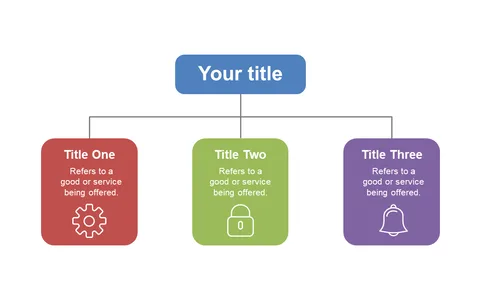
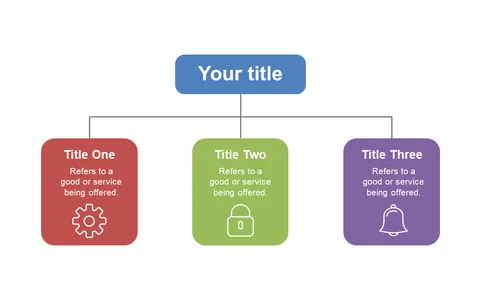
When it comes to collaboration, clarity is key, and team structures can often become complicated. This color-coded org chart slide simplifies that complexity, ensuring everyone knows their responsibilities and how they fit into the bigger picture.
It’s designed to enhance communication and prevent misunderstandings. This slide is particularly useful for project managers leading cross-functional teams, team leaders conducting team-building sessions, or organizational development professionals mapping out roles during strategic planning. It makes it easy to communicate hierarchy during any meeting where clarity is crucial.
You can grab this slide for only $0.99, and it’s available for instant download. Easily edit it in PowerPoint or Google Slides, making it ready to boost your team’s understanding in no time.
$0.99 – Purchase Checkout
Added to cart