Engage with Hexagonal Cycle Diagram for Strategies
Product Description
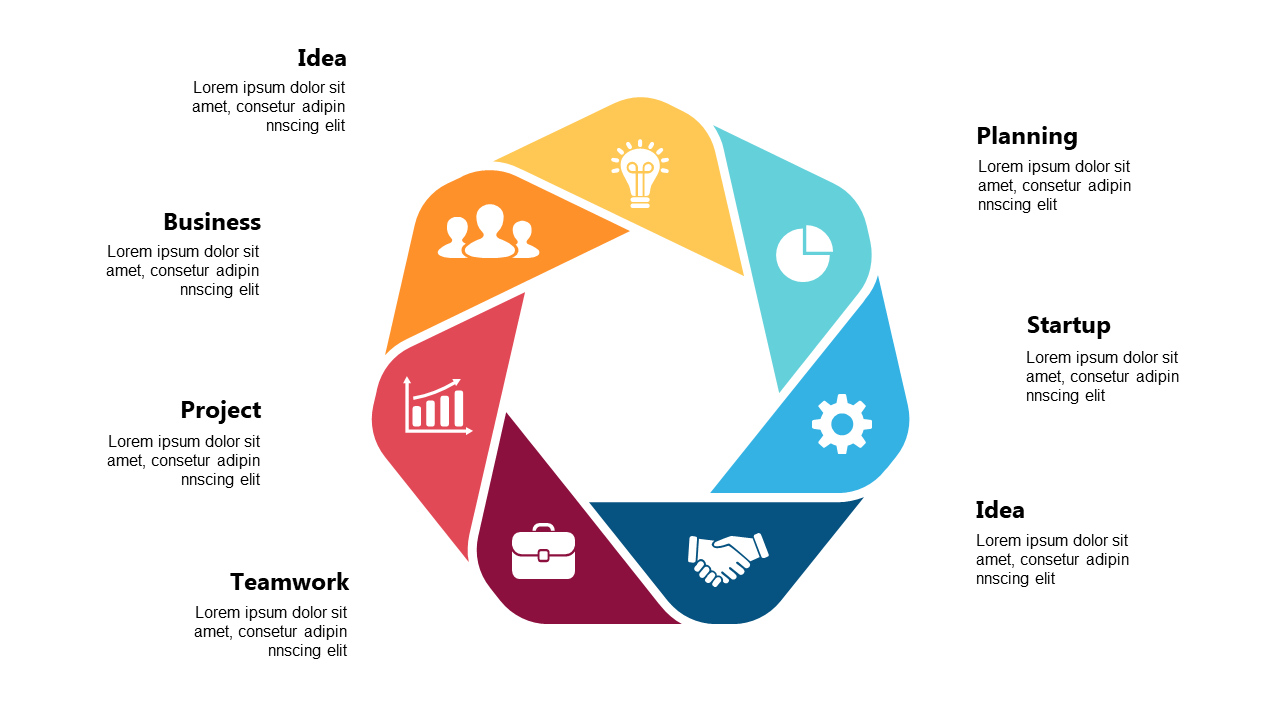
Finding it tough to keep your audience engaged while discussing essential strategies? This vibrant hexagonal cycle diagram helps you break down complex strategies into visually appealing segments, making your points clearer and more memorable.
It’s the perfect solution for showcasing how different business concepts interconnect. Think of this slide when you’re a business analyst presenting strategic plans, a sales leader outlining your approach to customer engagement, or an HR manager explaining employee development processes. It’s useful in board meetings, strategy sessions, or workshops where clear communication is key.
At just $0.99, this slide can be downloaded instantly and edited to suit your needs in both PowerPoint and Google Slides. Quick to customize, you can adjust colors and text to fit your presentation style in no time.
$0.99 – Purchase Checkout
Added to cart







