Compare UK and Ireland with Insightful Map
Product Description
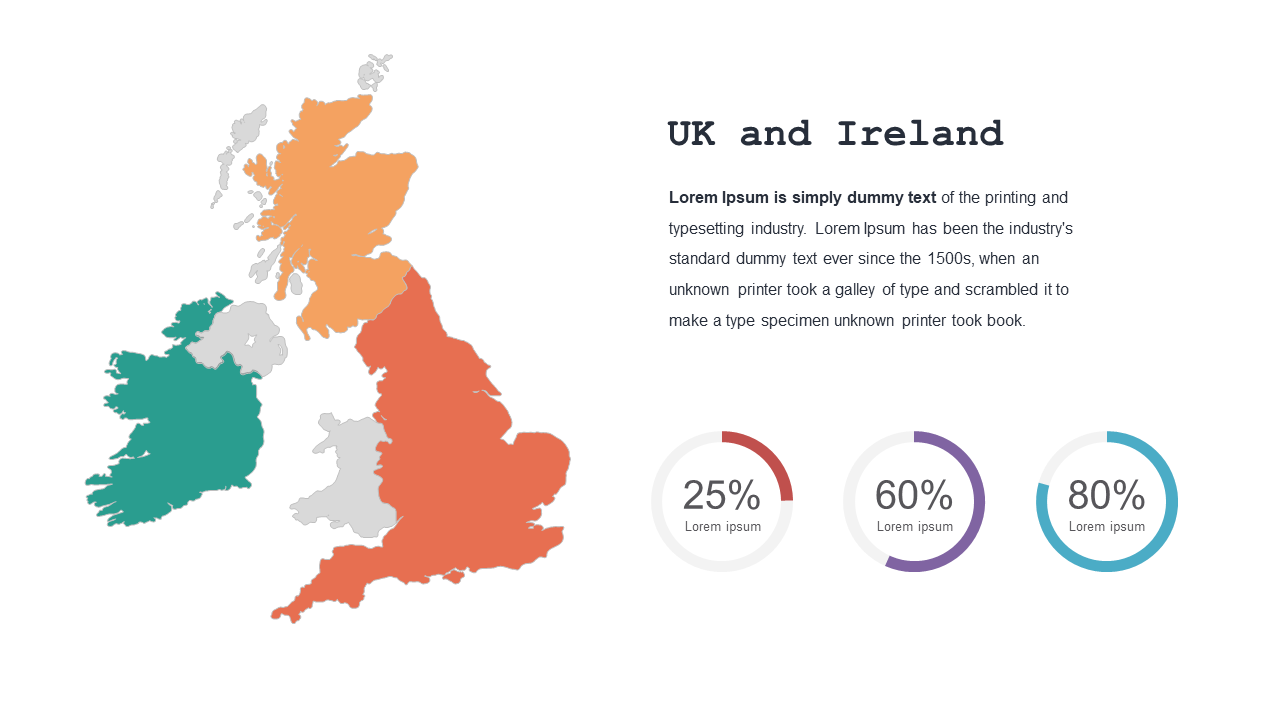
Effectively communicating geographic insights between the UK and Ireland is essential for informed decision-making. This slide features a detailed map that highlights key statistics, making it easy for your audience to see comparisons at a glance without sifting through data.
As a regional director or project manager, you’ll find this slide invaluable for meetings where you need to discuss market expansion, sales strategies, or performance metrics in the UK and Ireland. It provides a clear visual that supports your points and keeps everyone aligned in the discussion.
For only $0.99, you can instantly download this slide, ready to be customized to your specifications. It’s fully editable in both PowerPoint and Google Slides, making your prep work a breeze.
$0.99 – Purchase Checkout
Added to cart







