Visualize Task Progress with Gantt Chart

Product Description
Keeping track of project timelines can be daunting, especially when you’re managing numerous tasks and deadlines simultaneously. Without a clear visual tool to track progress, it’s easy to become overwhelmed and lose focus.
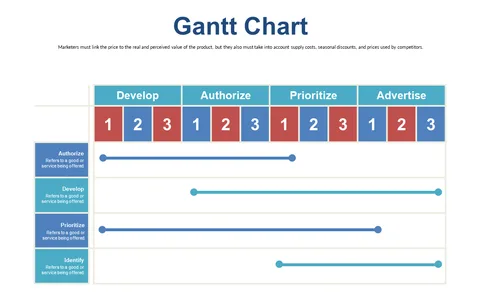
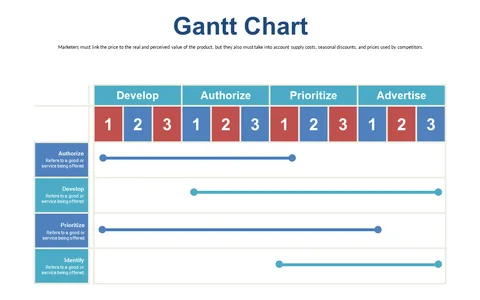
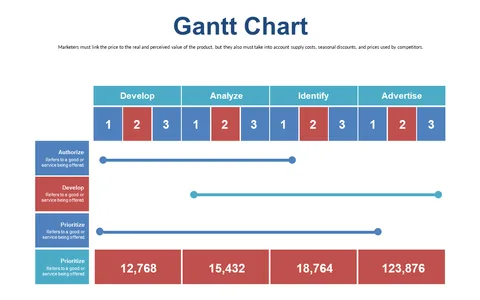
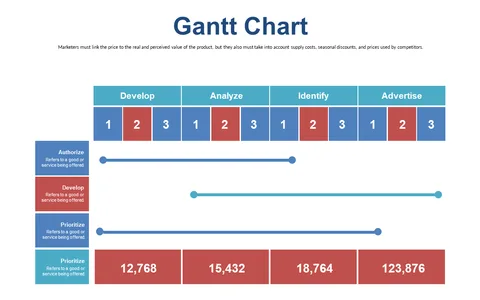
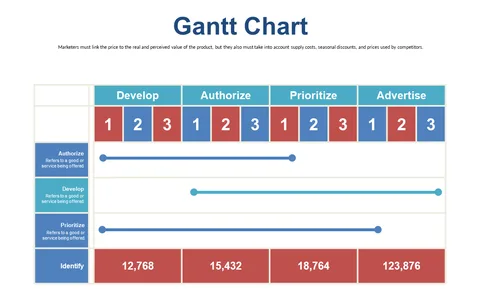
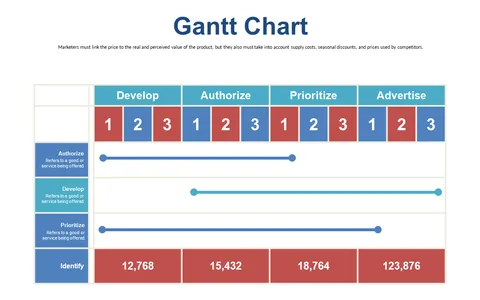
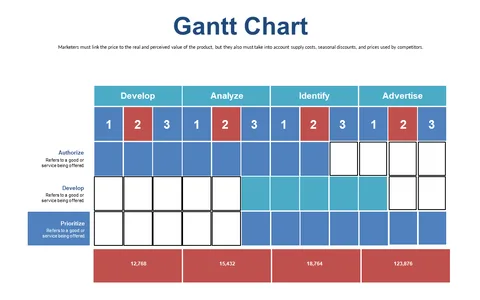
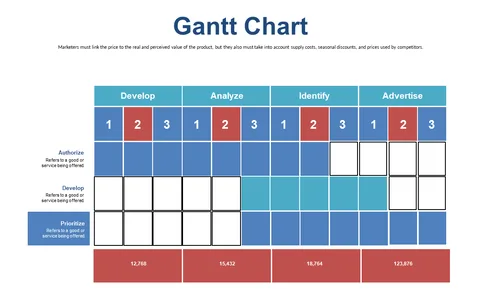
This Gantt chart slide lays out your project timeline in a straightforward manner while highlighting task progression at a glance. Ideal for project managers overseeing marketing campaigns or event planners organizing timelines for launches, this slide is designed for various contexts where clarity is crucial. Whether you’re presenting to a team or stakeholders, this visual tool helps ensure everyone is on the same page regarding what needs to happen and when.
Available for just $0.99, this Gantt chart slide can be downloaded instantly and is easy to edit in PowerPoint or Google Slides. With just a few tweaks, you can personalize it to your specific project, having it ready for use in minutes.
$0.99 – Purchase Checkout
Added to cart