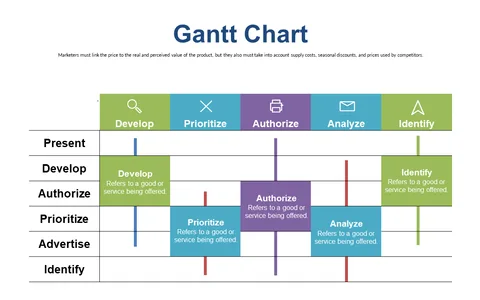
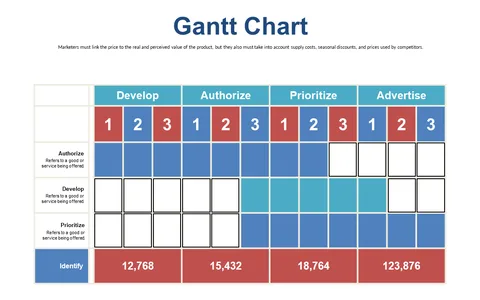
Gantt Chart for Project Activity Management
Product Description
Keeping a project on track can feel like a juggling act, especially when you have multiple tasks and deadlines to manage. A well-structured timeline can mean the difference between success and chaos.
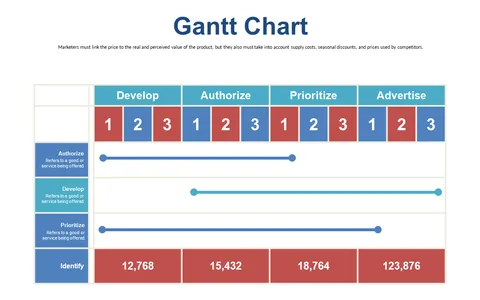
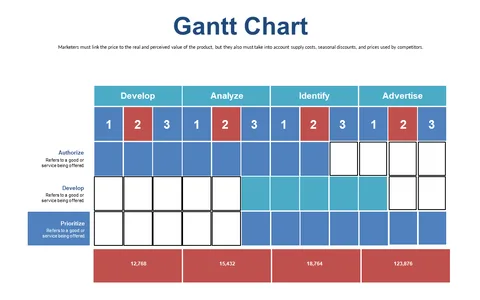
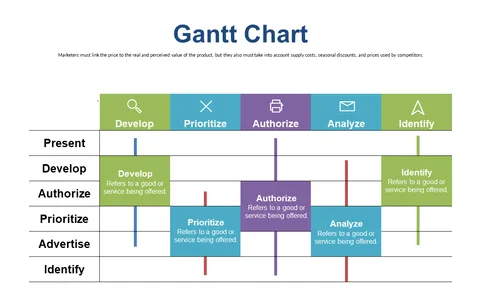
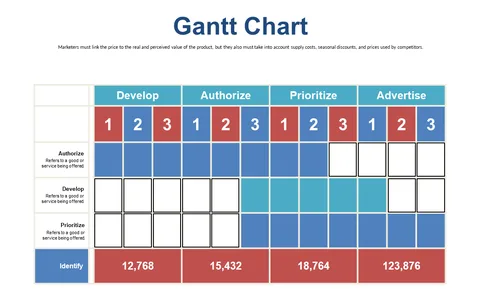
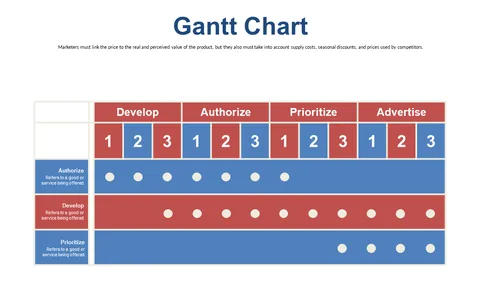
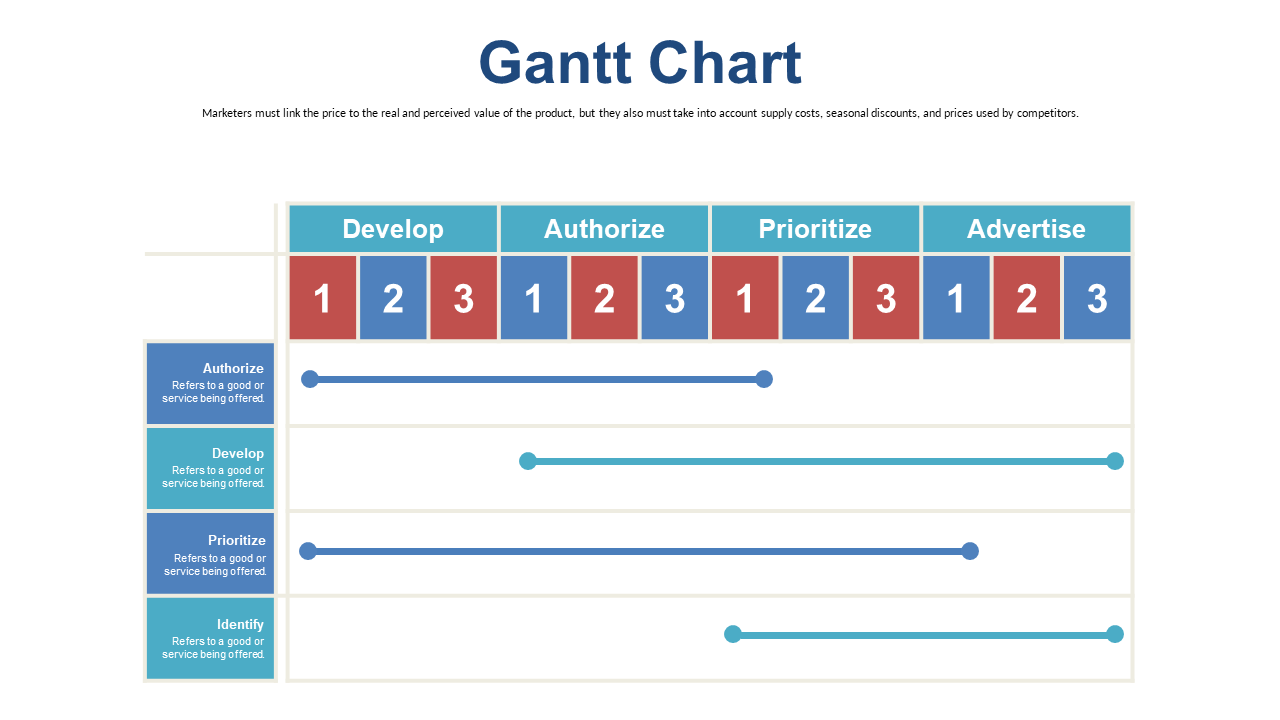
This Gantt Chart slide provides a clear visual representation, breaking down activities across four distinct phases so you can easily communicate your project’s flow. This slide is perfect for project managers in industries like construction or software development who need to present timelines in team meetings or update stakeholders on progress. It’s also useful for event planners coordinating various activities, ensuring that everyone is on the same page as deadlines approach.
For just $0.99, you can download this editable slide for instant use in PowerPoint or Google Slides. It’s easy to customize the task names and durations, helping you create a timeline that fits your specific project needs in just minutes.
$0.99 – Purchase Checkout
Added to cart