Streamline Project Workflows with Gantt Chart
Product Description
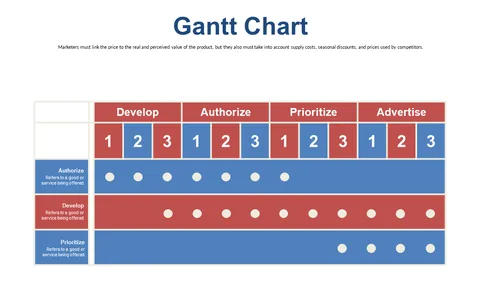
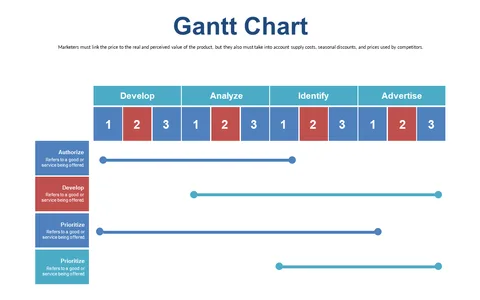
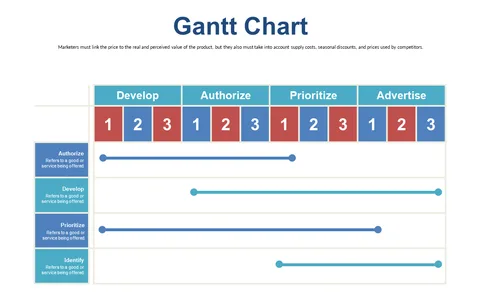
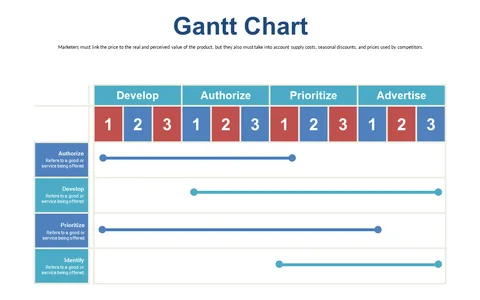
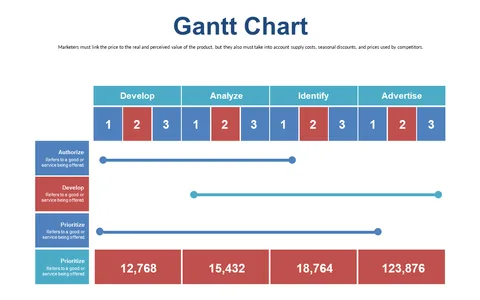
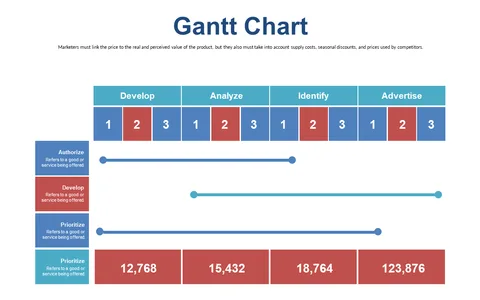
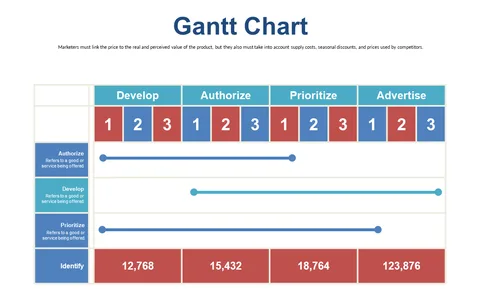
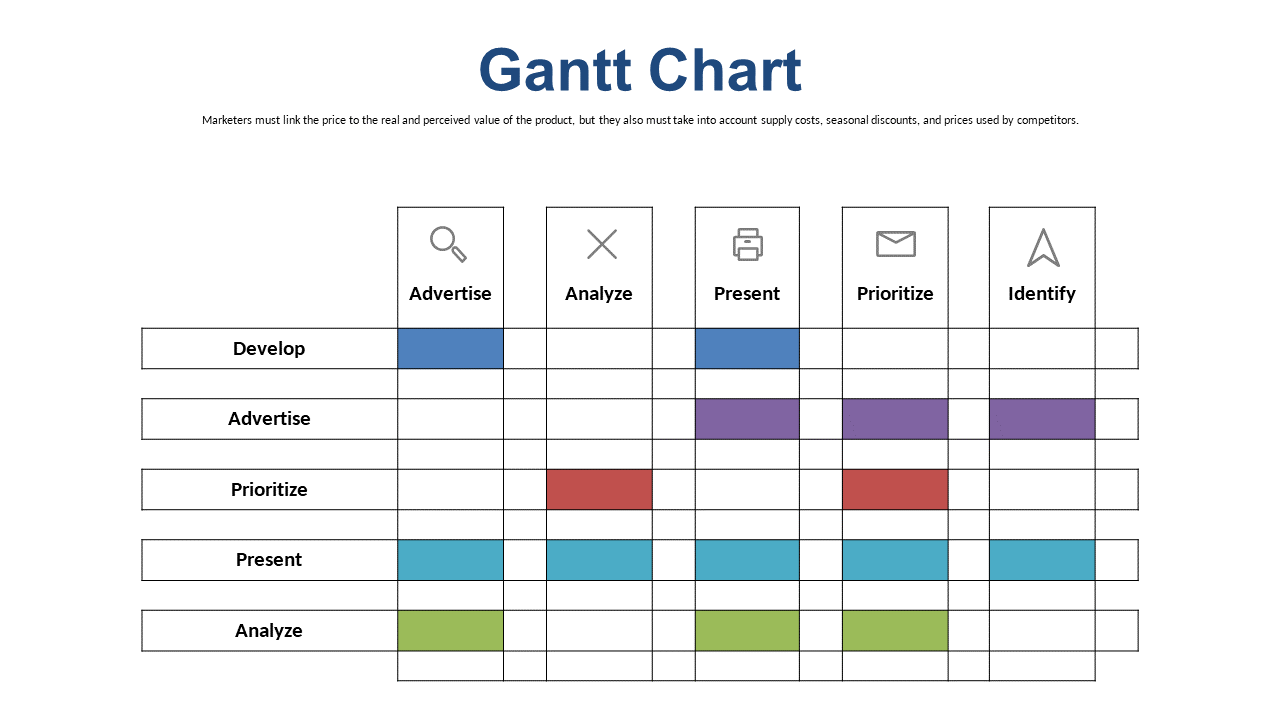
Navigating the ins and outs of project workflows can be a daunting task, especially when tasks and timelines seem to overlap. This Gantt chart slide simplifies that process by offering a clear visual layout that highlights task priorities and interdependencies, allowing for more effective project management.
This slide is perfect for project coordinators, team leaders, and business analysts who need to present project timelines during meetings, planning sessions, or review discussions. It makes the complexities of project management easier to understand, so everyone involved knows what to expect and when.
For only $0.99, you can immediately download this slide and make it your own in PowerPoint or Google Slides. Its user-friendly format allows for quick editing, so you can focus on delivering a successful project update in no time.
$0.99 – Purchase Checkout
Added to cart