Track Tasks and Priorities with Gantt Chart
Product Description
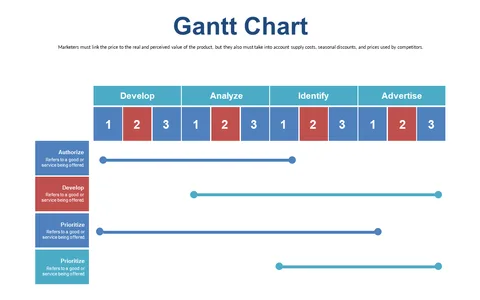
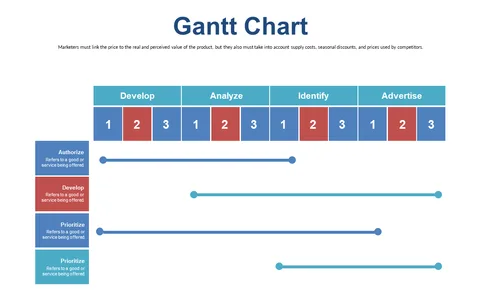
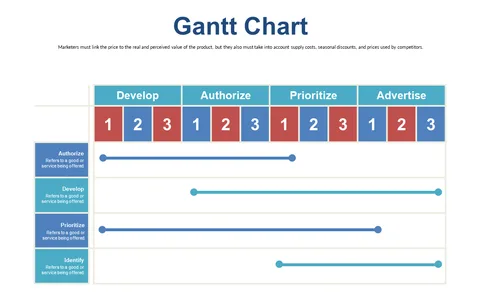
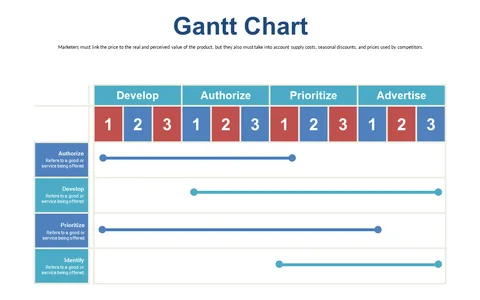
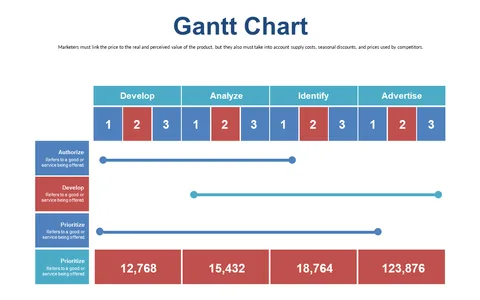
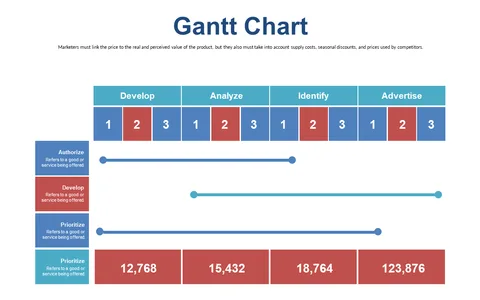
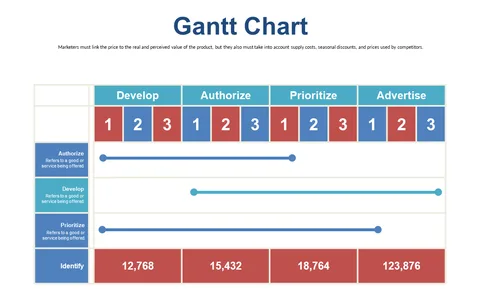
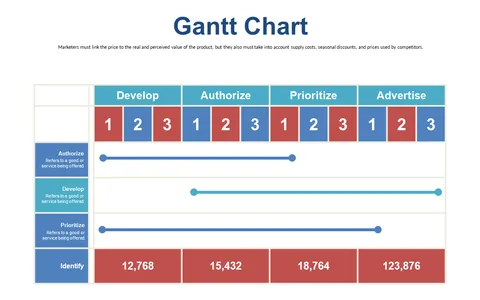
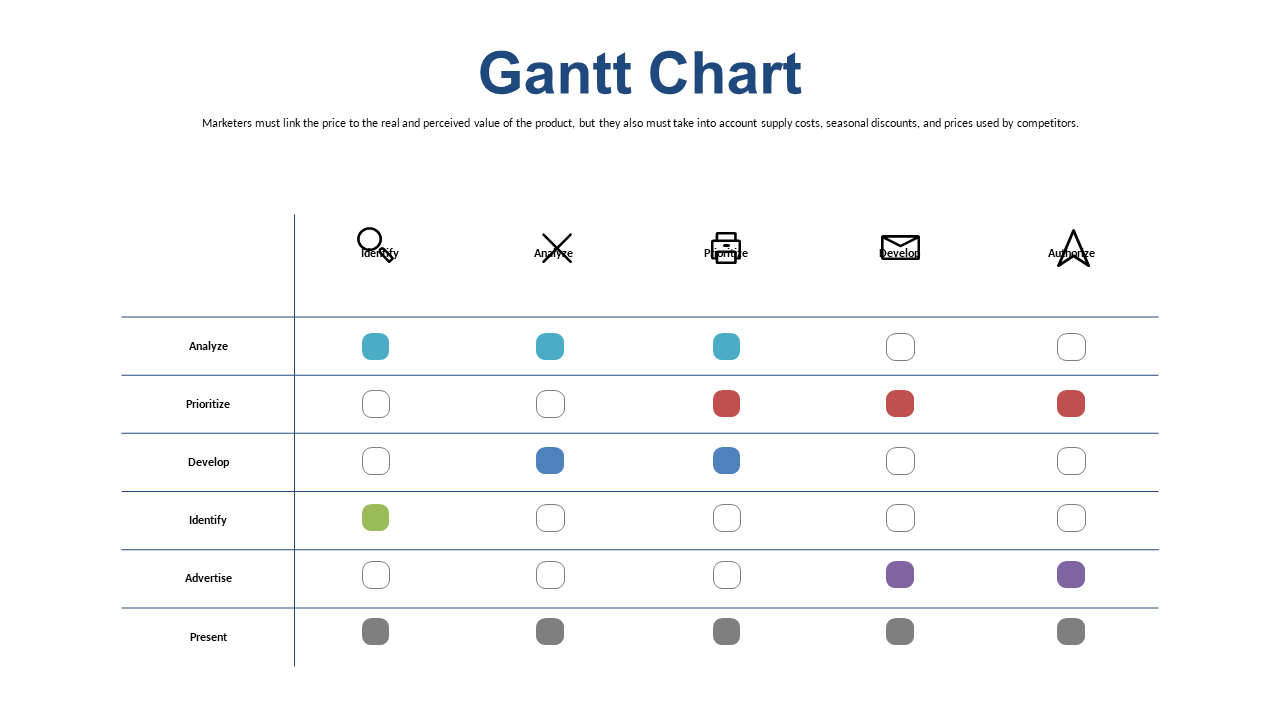
Keeping track of various tasks and their priorities can feel overwhelming, especially when projects overlap. You need a straightforward way to manage that chaos, and this Gantt chart slide provides the clarity you’re looking for.
It visually breaks down your tasks, timelines, and resource allocations, making effective project management much simpler. This slide is ideal for project managers, team leads, and any professionals juggling multiple assignments or initiatives. Whether you’re in IT, marketing, or operations, you’ll find this slide invaluable for team briefings, status updates, or planning sessions where clarity is key.
Available for only $0.99, this Gantt chart is ready to download instantly. Edit it easily in PowerPoint or Google Slides to fit your project needs and get back to focusing on what matters most.
$0.99 – Purchase Checkout
Added to cart