Visualize Task Assignments with Gantt Chart
Product Description
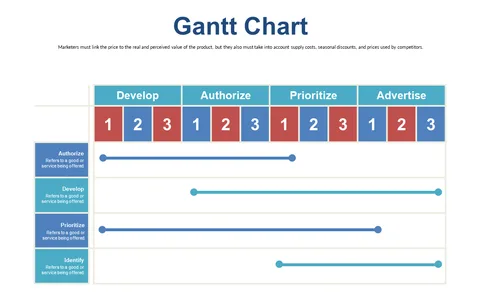
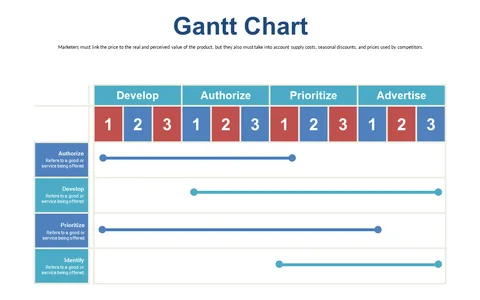
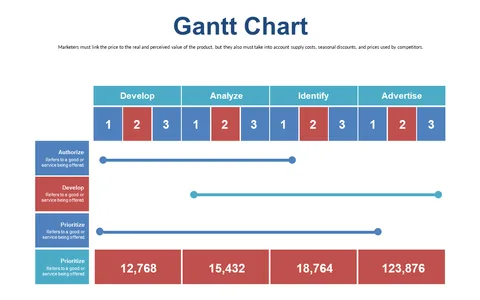
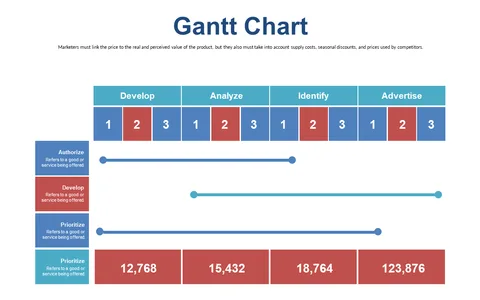
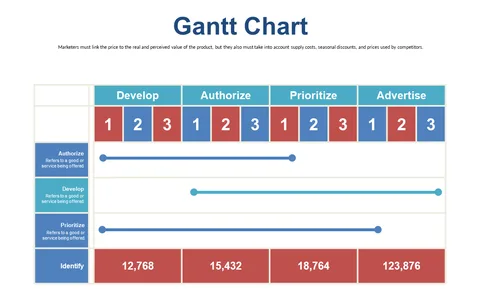
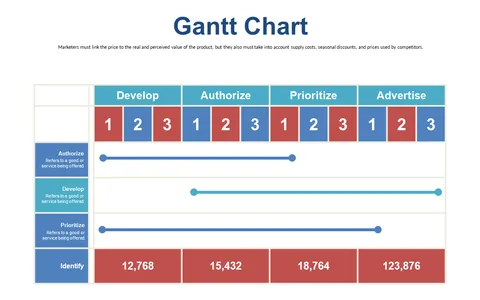
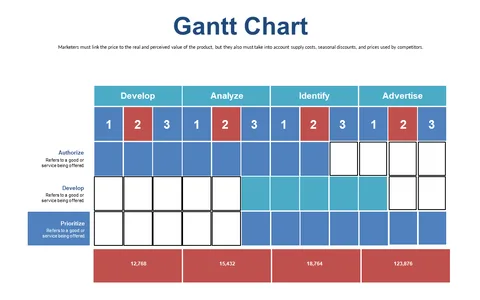
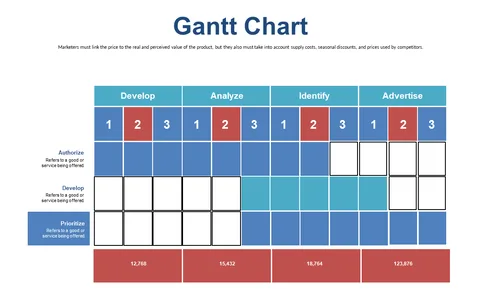
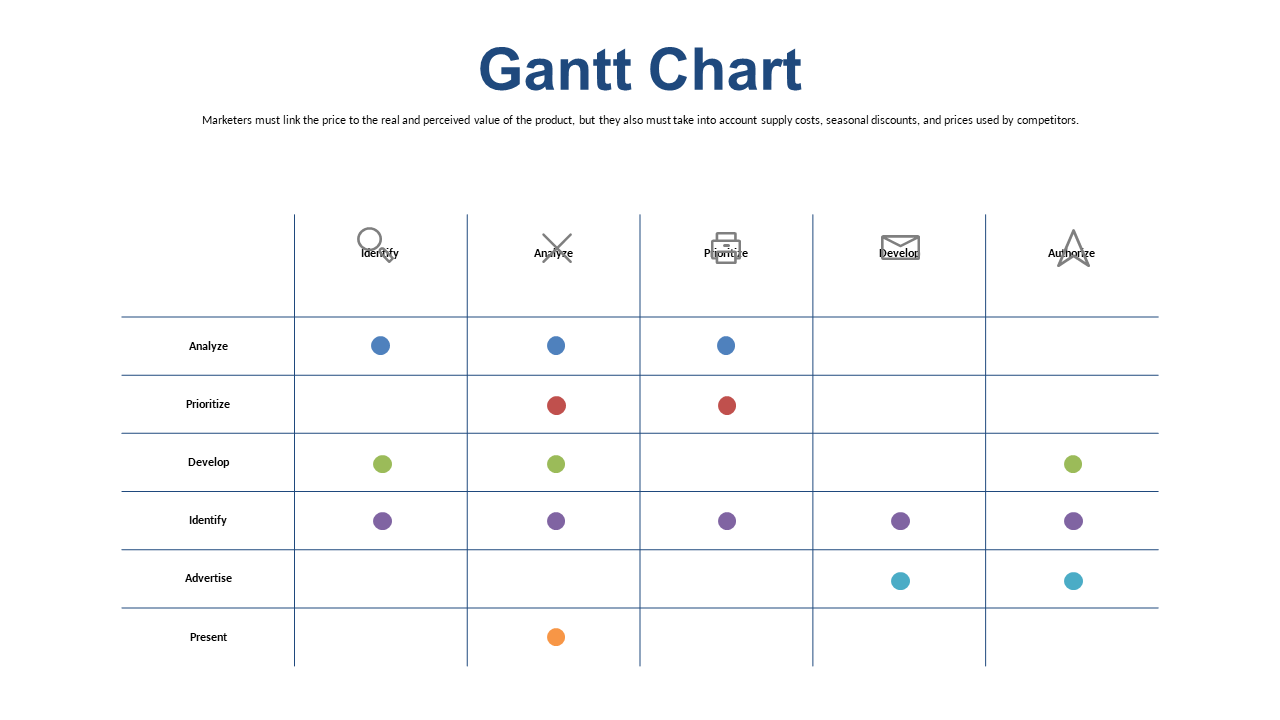
As a project manager, keeping your tasks organized can be a daunting task, especially when you have many team members involved. This Gantt Chart slide provides a clear visual representation of task assignments, helping to clarify who is responsible for what and when.
It’s an effective way to keep your team accountable and informed. Operations managers and team leads in the engineering sector will appreciate this slide during project updates and accountability meetings. This slide can help you convey task responsibilities effectively, making it easier for your team to stay aligned with project goals and deadlines.
Available for just $0.99, this Gantt Chart slide can be downloaded instantly. It’s editable in both PowerPoint and Google Slides, ensuring you can tailor it to fit your specific needs in a matter of minutes.
$0.99 – Purchase Checkout
Added to cart