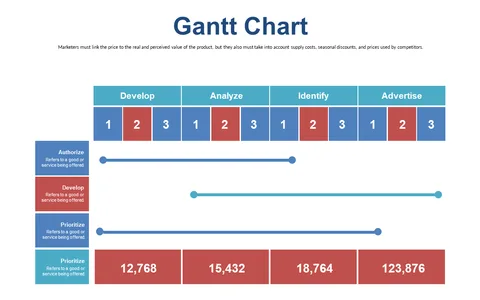
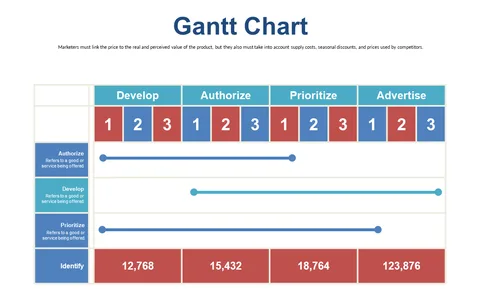
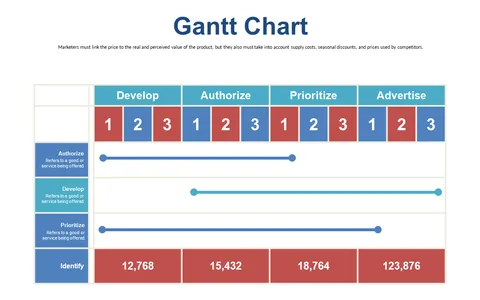
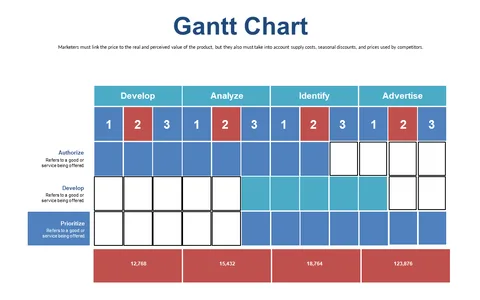
Track Project Phases with Gantt Chart
Product Description
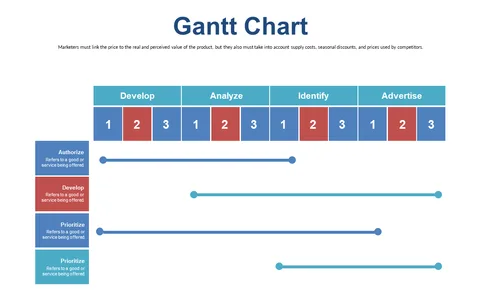
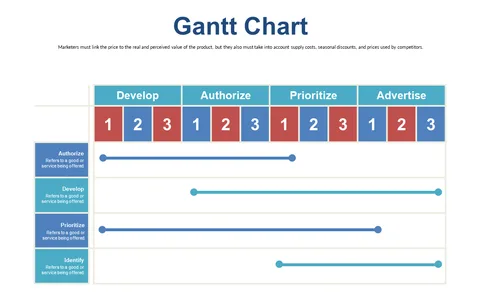
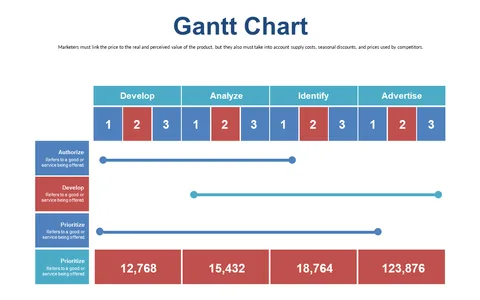
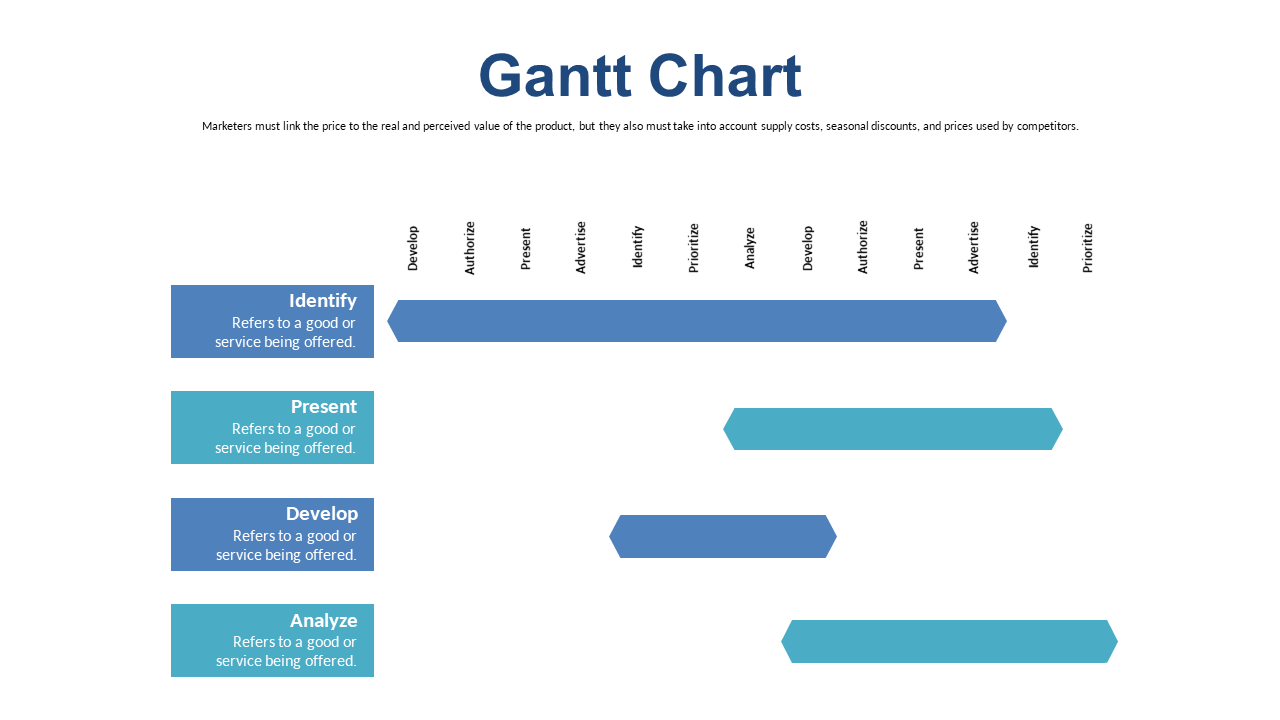
Feeling the pressure of tight deadlines and constant updates can make managing project phases a daunting task. This Gantt chart slide helps relieve some of that stress by offering a straightforward visual guide to track your progress and timelines clearly.
Ideal for project managers, product owners, or anyone in the technology sector, this slide is a game changer for status meetings and stakeholder presentations. You can seamlessly illustrate project phases and activities, ensuring that everyone is on the same page as you navigate through the project lifecycle.
Grab this slide for only $0.99, and you’ll receive an instant download that
you can customize in PowerPoint or Google Slides. Editing is a breeze, helping you create an organized visual that communicates your project’s progress effectively.
$0.99 – Purchase Checkout
Added to cart