Compare Metrics with Dual Percentage Circle Layout
Product Description
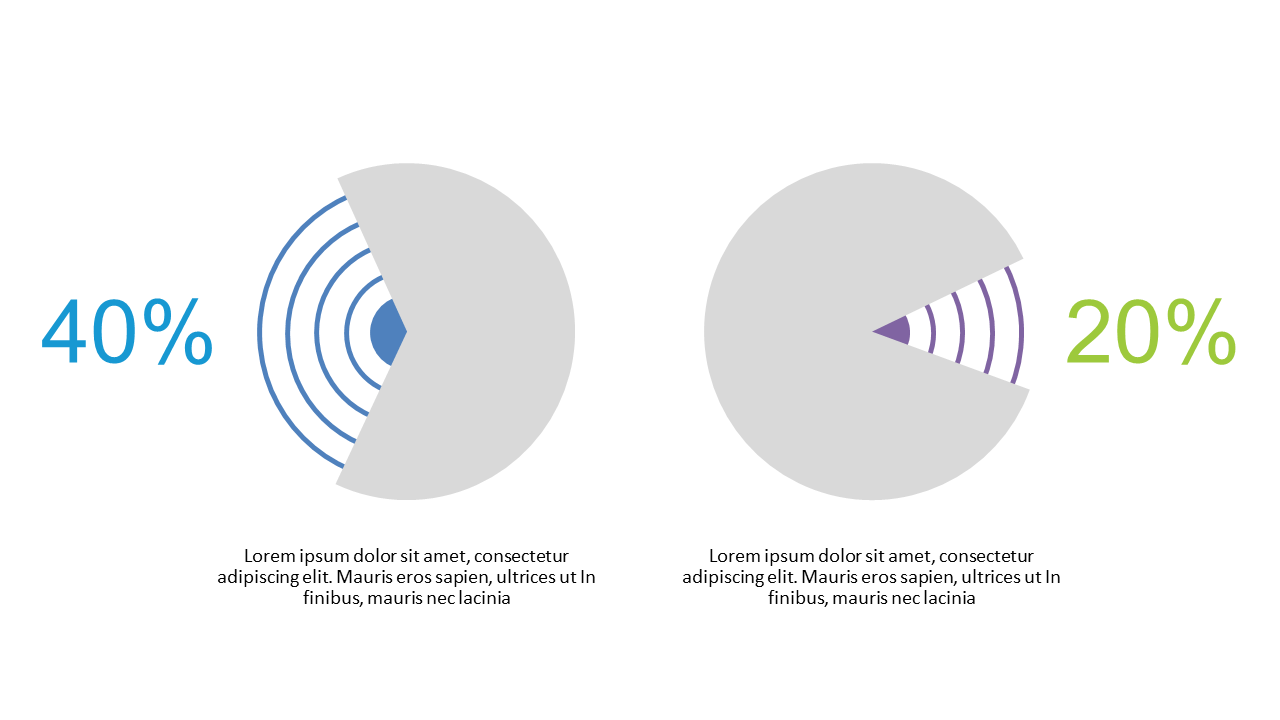
In a world where data is plentiful, comparing key metrics effectively can sometimes feel daunting. This dual percentage circle layout offers a straightforward and engaging way to visually contrast two sets of data, making your comparisons clear and understandable.
Marketing analysts, sales representatives, and performance managers will benefit from this slide during performance reviews, competitive analysis meetings, or client presentations. It provides a quick visual snapshot that can drive discussions around key performance indicators or survey results.
Download this slide for only $0.99 and have it ready to go in just minutes. It’s designed for easy editing in both PowerPoint and Google Slides, allowing you to customize it effortlessly to suit your needs.
$0.99 – Purchase Checkout
Added to cart







