Illustrate Cyclical Processes with Diagram
Product Description
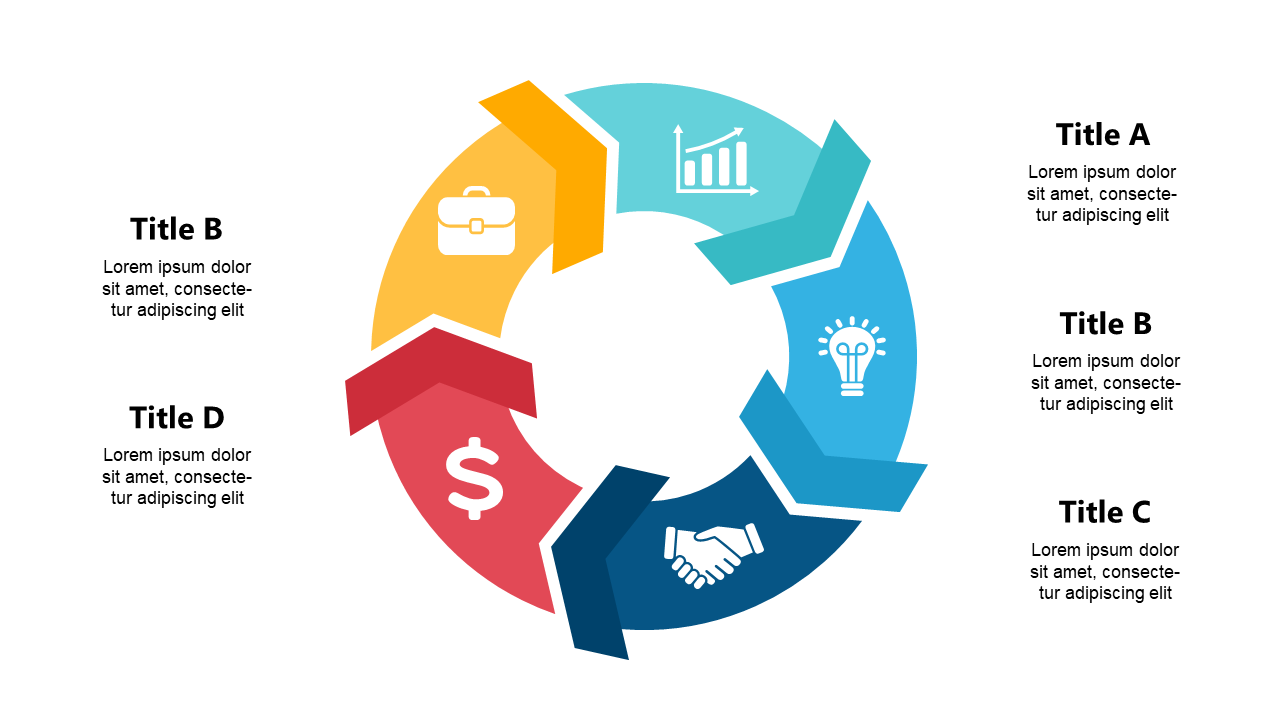
Explaining cyclical processes can be tricky, especially if you’re relying solely on text-heavy slides. This diagram provides a clear, visual aid that simplifies the explanation, allowing your audience to quickly grasp how various stages connect and flow into one another.
It’s a straightforward way to visualize complex ideas. You might find this slide particularly beneficial as a project coordinator detailing iterative processes in team retrospectives, or as a training supervisor explaining onboarding stages to new hires. It can also be used in academic presentations by educators looking to illustrate research methodologies in a classroom setting.
For only $0.99, this slide can be instantly downloaded and customized in PowerPoint or Google Slides. Edit it to fit your content and ensure your audience leaves with a solid understanding of your cyclical processes without any hassle.
$0.99 – Purchase Checkout
Added to cart







