Showcase Continuous Improvement with Cyclical Diagram
Product Description
In a landscape where continuous improvement is vital, showing your progress in a relatable way can be tricky. You want your audience to grasp how processes evolve without feeling overwhelmed by complexity.
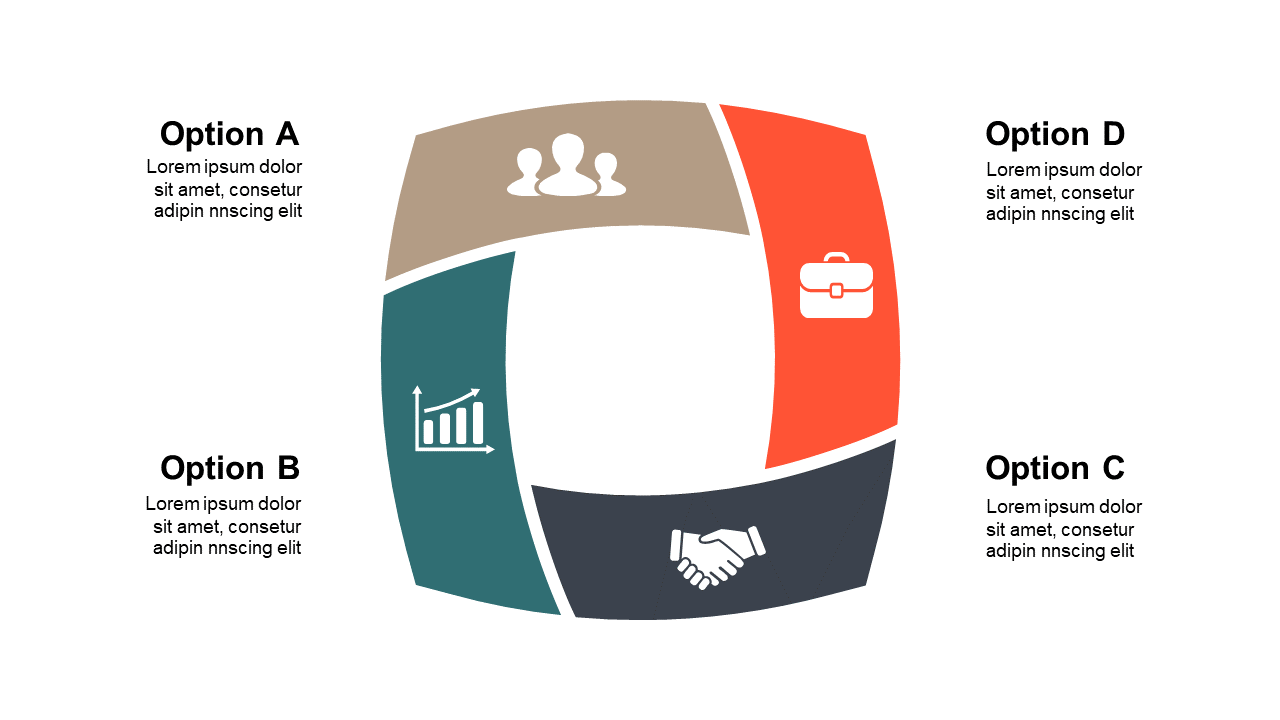
This cyclical diagram offers a straightforward visual representation to highlight each step of your continuous improvement initiatives. This slide is particularly handy for quality assurance specialists in healthcare, project leaders managing ongoing upgrades in tech companies, or business consultants conducting workshops on process improvement. Whether you’re sharing updates in a team meeting or presenting to clients about project efficacy, this diagram helps you articulate key points concisely.
For just $0.99, this slide is available for instant download and can be easily edited in PowerPoint and Google Slides. Spend just a few minutes tailoring it to your needs, and you’ll be ready to present with confidence.
$0.99 – Purchase Checkout
Added to cart







