Illustrate Workflows with Cyclical Process Diagram V5
Product Description
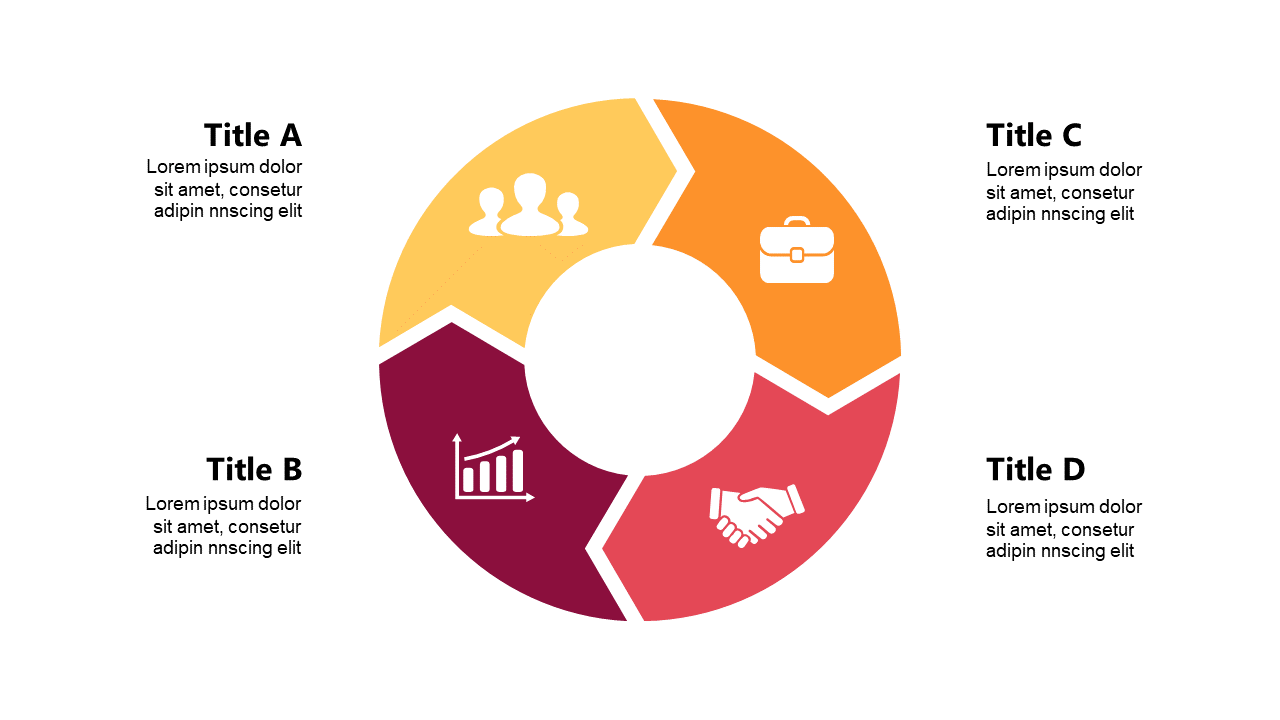
When you’re trying to convey cyclical processes, clarity is key to maintaining engagement and understanding. This slide provides a visually appealing solution, showcasing a clear circular diagram that simplifies complex workflows.
It’s perfect for ensuring that your audience is on the same page as you navigate through your process descriptions. This diagram is ideal for operations managers discussing workflow efficiencies, project coordinators detailing process steps, or training leaders explaining new methodologies. If you’re hosting a workshop or leading a strategic planning session, this visual will help you communicate your ideas more clearly.
For only $0.99, you can download this slide immediately and modify it in both PowerPoint and Google Slides. It’s user-friendly and ready to enhance your presentations, allowing you to focus on delivering your message effectively.
$0.99 – Purchase Checkout
Added to cart







