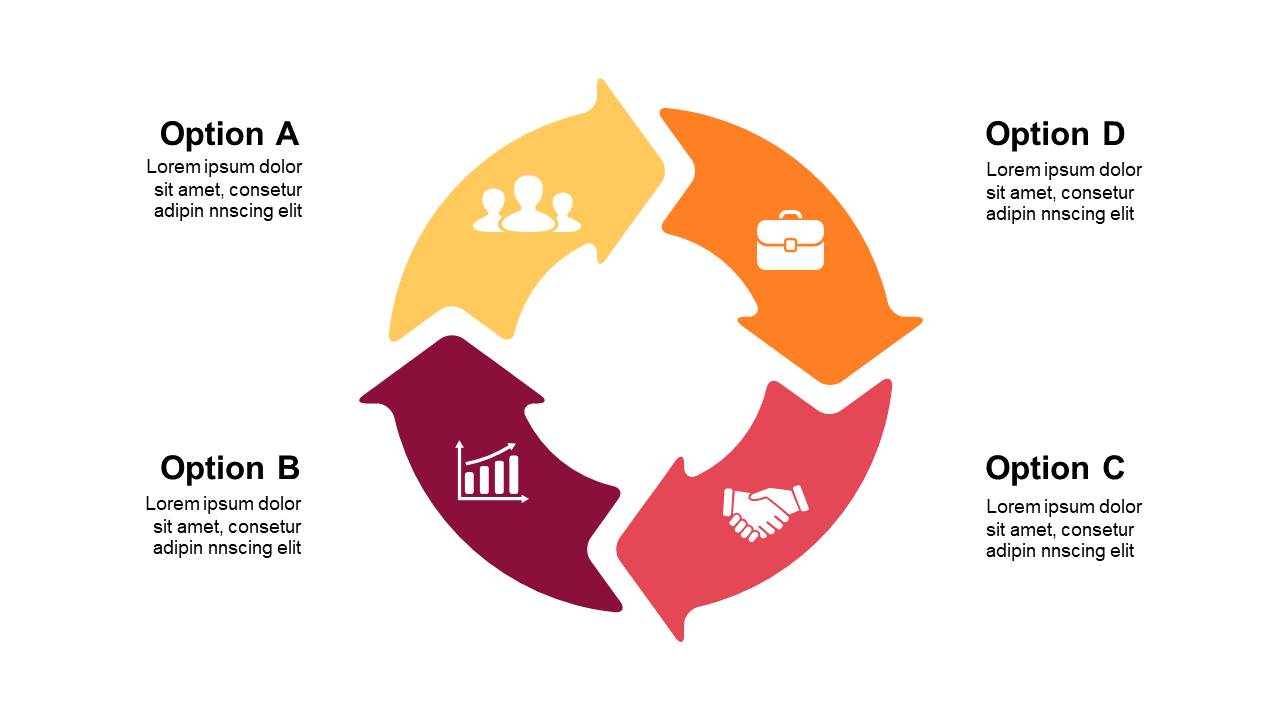
Depict Project Stages with Cyclical Process Diagram
Product Description
Managing multiple projects can feel chaotic, especially when you need to break down complex workflows for others to understand. It’s crucial to present information in a straightforward manner that captures attention and drives understanding. This cyclical process diagram does just that, visually representing project stages in a way that resonates with your audience.
Consider this slide for use by program managers overseeing large initiatives, business analysts outlining project phases for stakeholders, or team leaders conducting retrospective meetings. Whether you’re presenting to upper management or discussing progress with your team, this diagram will enhance your communication and make your insights more memorable.
At just $0.99, this slide is quick to download and simple to edit in PowerPoint and Google Slides.
You can customize it easily to align with your project’s needs, making your presentation come together effortlessly.
$0.99 – Purchase Checkout
Added to cart







