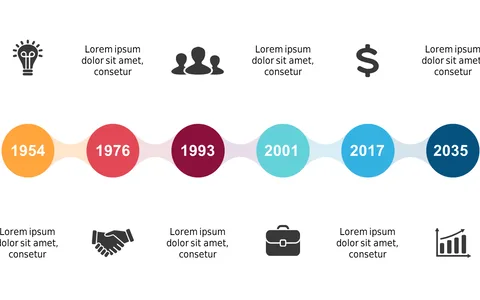
Present Historical Events with a Curved Timeline

Product Description
When recounting a series of historical events or project milestones, a cluttered timeline can lead to confusion and miscommunication. This curved timeline slide allows you to present information clearly and visually, making it easier for your audience to follow along. With clear icons marking each milestone, it captures attention while providing essential context.
History teachers, researchers, and project coordinators will find this slide particularly useful in presentations, lectures, or reports. Whether you’re discussing key historical events in a class or outlining milestones in a project overview meeting, this slide delivers clarity and engagement.
It allows you to present complex information without overwhelming your audience. Grab this slide for just $0.99, and you can edit it effortlessly in PowerPoint or Google Slides. It’s a quick download, meaning you can elevate your presentations in minutes with visuals that make a difference.
$0.99 – Purchase Checkout
Added to cart