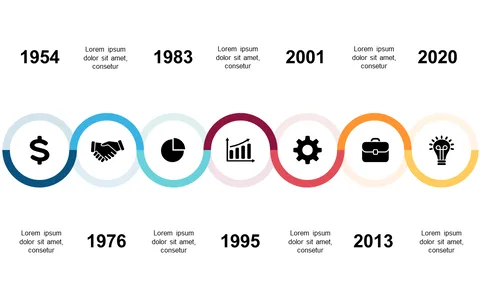
Present Chronological Events with a Curved Timeline

Product Description
Presenting a sequence of events can often lead to confusion, especially when timelines are cluttered and hard to follow. A curved timeline like this one simplifies your story by highlighting each milestone in a visually appealing manner, making it easier for your audience to grasp the flow of events.
This slide is perfect for project managers detailing a product launch sequence, educators outlining historical events, or anyone in marketing showcasing the evolution of a brand. You’ll find it particularly helpful in team meetings or client presentations where clarity and engagement are paramount.
You can download this slide for just $0.99, and it’s ready for you to edit in PowerPoint or Google Slides. Customize it in minutes to fit your specific needs and make your presentation stand out.
$0.99 – Purchase Checkout
Added to cart