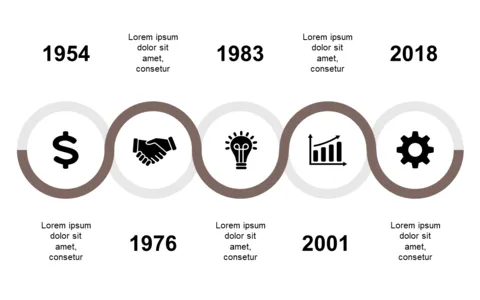
Showcase Revenue Growth with Curved Timeline

Product Description
When it comes to showcasing revenue growth, presenting complex data can be daunting. This curved timeline slide takes the pressure off by allowing you to showcase key milestones and growth in a visually appealing and straightforward format.
The sleek design ensures your audience remains engaged while you present vital information. Finance professionals, business development managers, and marketing strategists will find this slide invaluable during investor meetings, revenue assessments, or strategic planning sessions. It’s particularly effective in illustrating growth trajectories that captivate stakeholders’ attention.
For only $0.99, you can instantly download this slide and easily edit it in PowerPoint or Google Slides. Tailor it to reflect your unique revenue story in just minutes, elevating your presentation with impactful visuals.
$0.99 – Purchase Checkout
Added to cart