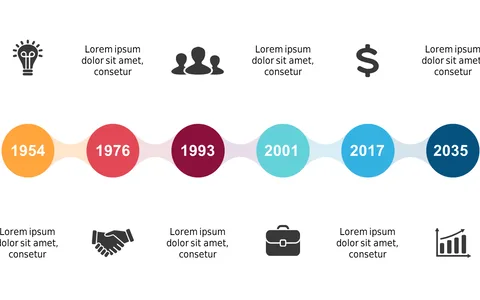
Track Business Progress with Curved Timeline

Product Description
In the fast-moving world of project management, illustrating your business progress clearly is crucial. This curved timeline design provides a visually engaging way to showcase significant milestones without overwhelming your audience with information.
It’s a great fit for business analysts monitoring project phases, team leaders presenting growth reports, or any professional needing to convey progress in a clear manner. The slide’s layout is adaptable for various industries, ensuring that it serves your presentation needs effectively.
For just $0.99, you can instantly download this slide and customize it in PowerPoint or Google Slides. Prepare to impress your audience with a visually appealing tool to track your business progress.
$0.99 – Purchase Checkout
Added to cart