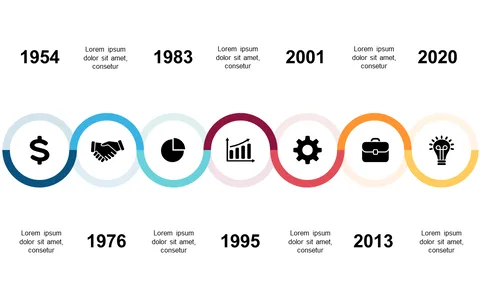
Curved Timeline for Project Milestones Presentation

Product Description
Conveying project timelines can quickly become confusing, especially when you have multiple milestones to discuss. An operations manager often struggles to present these sequences clearly, leading to misunderstandings. This curved timeline slide offers a visually engaging way to display your project milestones, ensuring that everyone stays on the same page.
Project managers, team leads, and operations staff will find this slide invaluable for sprint reviews, project kickoff meetings, or progress updates. Whether you’re in tech, construction, or marketing, using this timeline will help you narrate your project story more effectively.
You’ll appreciate how the colorful circles marking key milestones add a sense of clarity to your presentations. Download this slide for just $0.99, and you’ll find it easy to customize in PowerPoint or Google Slides. It’s ready to use in minutes, so you can focus on delivering your message instead of worrying about your visuals.
$0.99 – Purchase Checkout
Added to cart