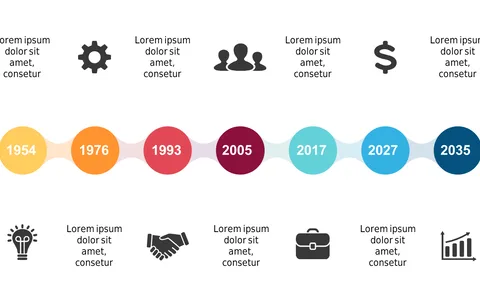
Visualize Achievements with a Curved Timeline Infographic

Product Description
Communicating achievements and progress effectively can be a significant hurdle for many product managers. A cluttered or poorly structured timeline can dilute the message you want to convey. This curved timeline infographic offers a visually engaging way to present your accomplishments, ensuring your audience grasps the key points at a glance.
This slide is ideal for product managers, project directors, and marketing professionals presenting updates to teams or clients. Whether you’re sharing product development milestones, quarterly achievements, or strategic planning sessions, this slide will help you articulate your progress clearly and effectively. The visual appeal aids in keeping your audience focused and engaged.
Available for just $0.99, this slide is an instant download that
you can easily customize in PowerPoint or Google Slides. You’ll be ready to present in minutes, with a professional-looking visual that supports your narrative.
$0.99 – Purchase Checkout
Added to cart