Illustrate Decision-Making with Cycle Diagram
Product Description
Making choices can be overwhelming without a clear visual representation of the decision-making process. If your audience struggles to visualize how options link together, your message could get lost in translation.
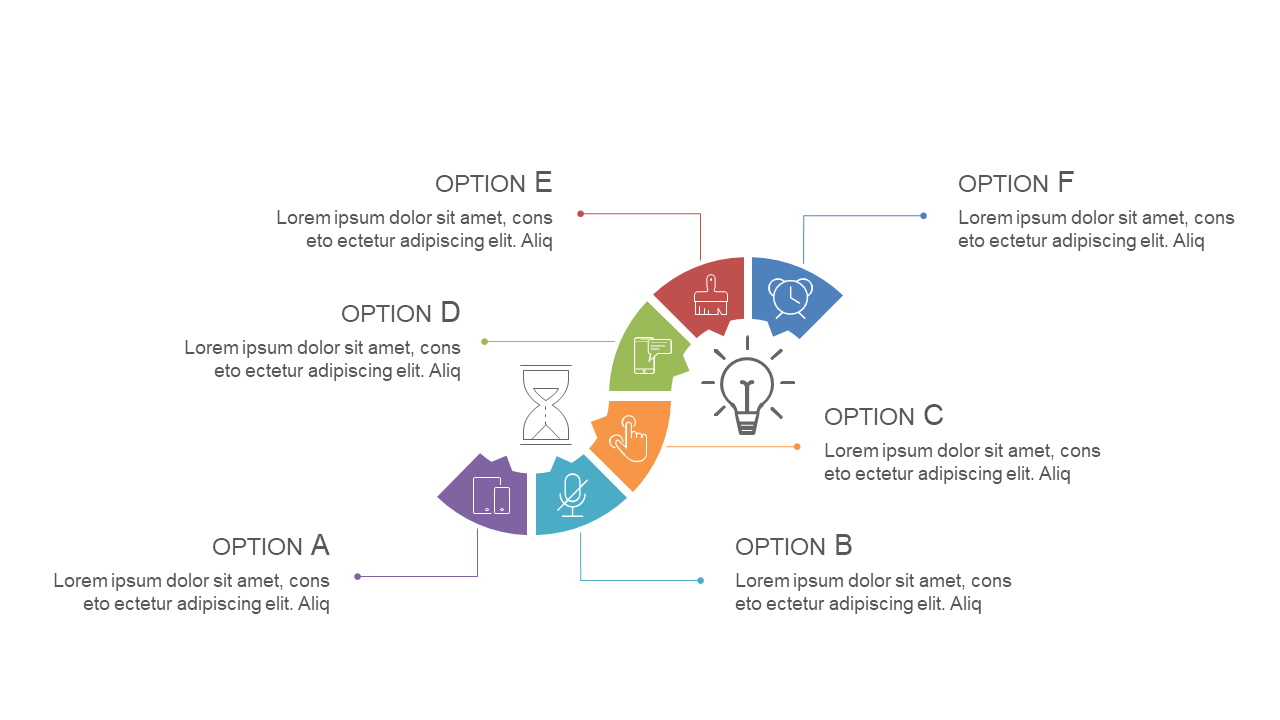
This cycle diagram slide simplifies complex decisions, allowing you to present information in a way that’s easy to digest. This slide works wonders for team leaders conducting strategic planning sessions, marketing professionals comparing campaign options, or finance analysts discussing investment decisions in board meetings. The dynamic flow will help your audience visualize their choices and the implications of each path.
Available for just $0.99, this slide is ready for download and easy to edit in PowerPoint and Google Slides. Tailor it to your specific needs and make your point crystal clear within minutes.
$0.99 – Purchase Checkout
Added to cart







