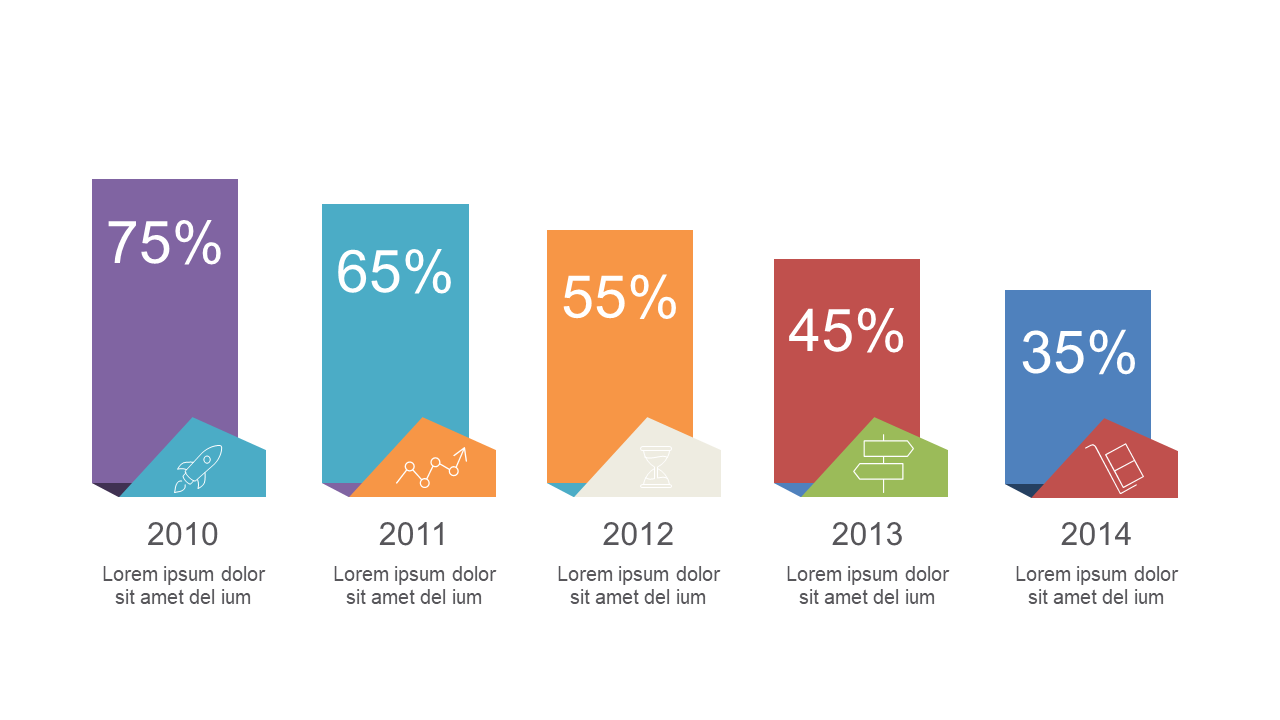
Present Yearly Data with Vertical Bar Chart
Product Description
When you need to present yearly data, it’s crucial that your audience can easily interpret the numbers you’re showcasing. A cluttered or confusing graph can lead to misinterpretations and lost interest.
This vertical bar chart slide cuts through the noise, providing a vibrant and clear visualization that makes your data pop. This slide is perfect for financial analysts preparing annual reports, marketing managers showcasing yearly campaign performance, or executives presenting company growth during board meetings. By utilizing this chart, you can confidently convey trends and comparisons that resonate with your audience’s needs and expectations.
For just $0.99, you can download this eye-catching slide and edit it effortlessly in PowerPoint or Google Slides. It’s ready to go in minutes, allowing you to focus on what really matters: delivering your message with clarity.
$0.99 – Purchase Checkout
Added to cart







