Visualize Data Comparisons with Vertical Bar Chart
Product Description
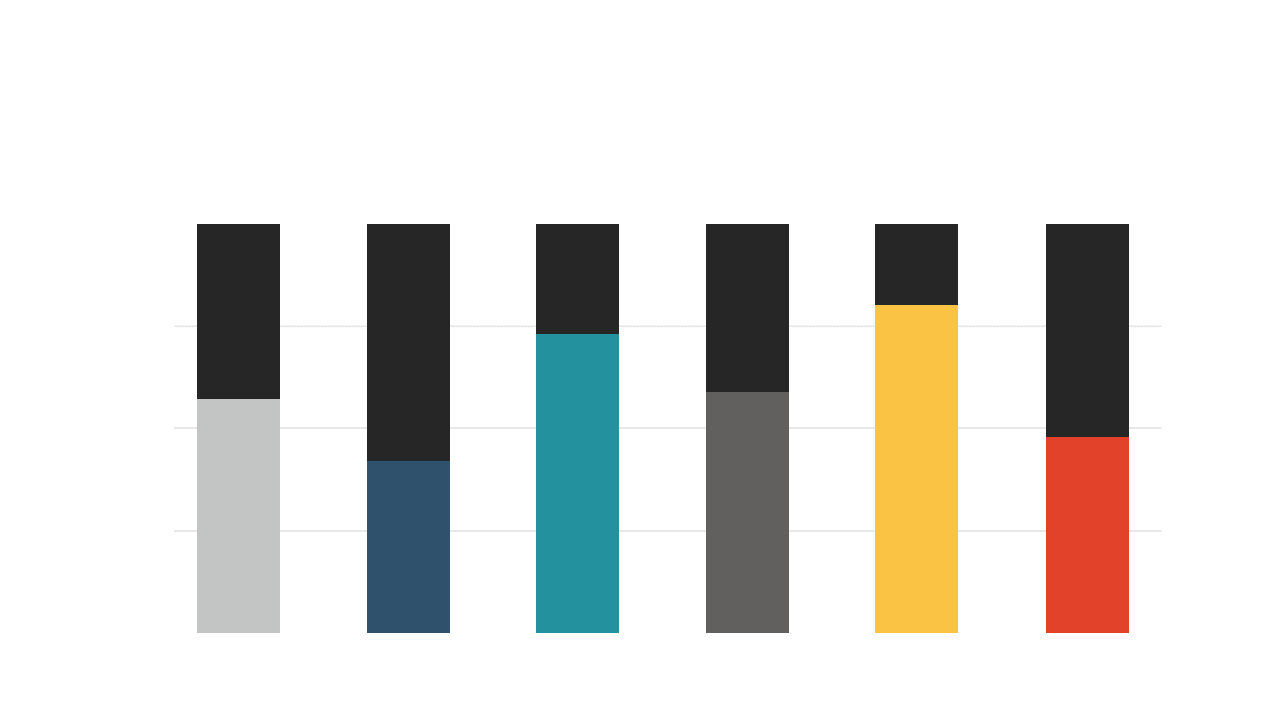
In a world where data is king, standing out with your insights is essential to making an impact. This vertical bar chart slide is designed to help you present key comparisons in a vibrant and engaging way, so your audience can quickly grasp the information.
The eye-catching design ensures your data isn’t just numbers but a story ready to be told. This slide is ideal for data analysts, sales managers, or finance professionals preparing for weekly reports or stakeholder presentations. Whether you’re showcasing quarterly results or comparing sales figures across different regions, this chart will help clarify your message and keep your audience engaged.
You can download this slide for just $0.99, and it’s fully editable in both PowerPoint and Google Slides. Make your data visual and impactful within minutes, and take your presentations to the next level.
$0.99 – Purchase Checkout
Added to cart







